
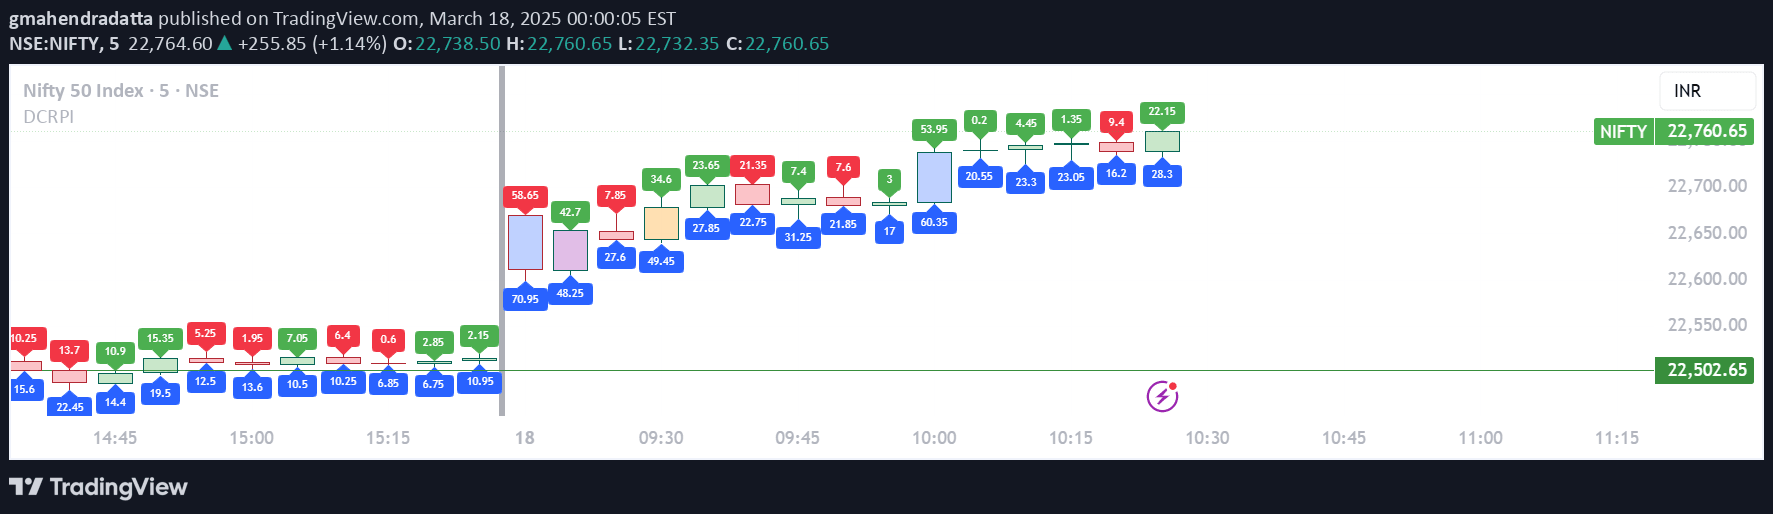
A specialized candle indicator that visually highlights price movements by displaying point ranges and color-coding candle borders based on movement intensity.
Explore complementary indicator rolesHow it works
The Dynamic Candle Range Point Indicator operates by analyzing each candle's price movement in two distinct dimensions. At the top of each candle, it calculates and displays the points moved from open to close, representing the candle's body range.
At the bottom of the candle, the indicator shows the total price movement from the highest to lowest point, giving traders a comprehensive view of price volatility. The unique color-coding system assigns different border colors based on the magnitude of price movement, allowing for quick visual identification of significant price changes.
Why it may be useful
The indicator provides traders with an immediate visual representation of price volatility, helping them quickly assess market dynamics without extensive numerical analysis. By color-coding candle borders, it transforms complex price movement data into an easily digestible format.
This visual approach allows traders to rapidly identify significant price movements across multiple timeframes, enhancing decision-making speed and reducing cognitive load during market analysis. The intuitive design makes it easier to spot potential trading opportunities and understand market sentiment at a glance.
When to explore it
The Dynamic Candle Range Point Indicator is most effective in fast-moving markets where quick visual assessment of price volatility is crucial. It works exceptionally well for traders who need to make rapid decisions in scalping and day trading environments.
The indicator is particularly useful during periods of market uncertainty, such as economic announcements, earnings reports, or significant news events that might cause substantial price fluctuations. Traders can use this tool to quickly gauge market momentum and potential trend changes across various financial instruments.
Keep exploring
What we’ve verified
Access, alerts and repainting behaviour have not been independently verified for this indicator. Check the creator’s current publication and settings.
General descriptions and classifications are recovered research. Verified details above identify the specific checks we have completed. Check the creator’s current publication for later changes.


