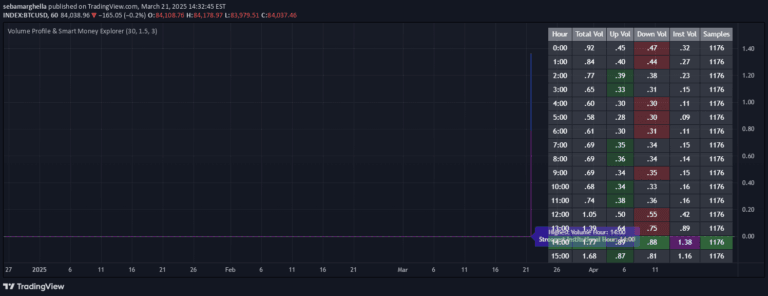
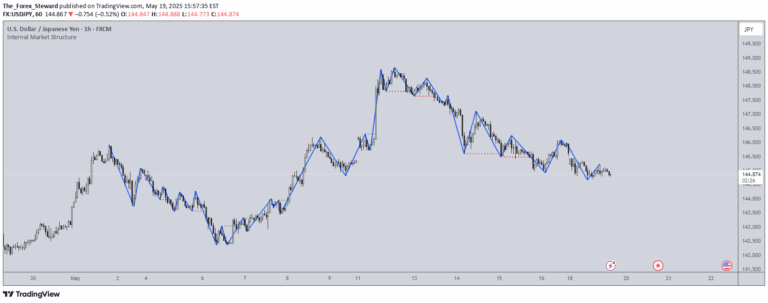
A sophisticated trading tool that identifies institutional liquidity levels and key market dynamics across multiple timeframes, helping traders make informed trading decisions.
Explore complementary indicator rolesHow it works
The ICT IPDA Liquidity Matrix analyzes market dynamics by tracking key institutional levels across multiple timeframes using 20, 40, and 60-period lookbacks. It identifies critical high and low points on both high time frames (HTF) and low time frames (LTF), providing a comprehensive view of market structure and potential liquidity zones.
The indicator calculates and displays daily open prices, key highs and lows, and uses intelligent overlap management to prioritize the most relevant levels. It updates dynamically at the start of each new daily candle, ensuring traders have access to the most current market information and institutional trading insights.
Why it may be useful
The ICT IPDA Liquidity Matrix provides traders with a sophisticated tool for understanding institutional trading behavior and market dynamics. By revealing key liquidity levels and institutional reference points, it helps traders align their strategies with dominant market forces and make more informed trading decisions.
The indicator's comprehensive approach allows traders to gain insights across multiple timeframes, from intraday movements to longer-term trends. Its ability to highlight critical support and resistance levels, combined with customizable display options, empowers traders to develop more precise and strategic trading approaches.
When to explore it
The indicator is most effective when used by traders seeking to understand institutional market dynamics and liquidity zones across different trading timeframes. It is particularly valuable during periods of market consolidation or when looking to identify potential entry and exit points based on institutional trading patterns.
Traders can maximize the tool's effectiveness by combining it with other technical analysis methods and risk management strategies. It is especially useful for those trading liquid markets with significant institutional participation, such as major forex pairs, cryptocurrency pairs, and prominent stock indices.
Keep exploring
What we’ve verified
Access, alerts and repainting behaviour have not been independently verified for this indicator. Check the creator’s current publication and settings.
General descriptions and classifications are recovered research. Verified details above identify the specific checks we have completed. Check the creator’s current publication for later changes.