YOUR INDICATOR RESEARCH STARTS HERE

Find the right indicator.
Understand what it does.

Explore 11,183 indicators. Filter beyond the obvious.
Discover the tools that fit the way you trade.

THE INDICATOR LIBRARY

Results for “matrix”

11,183 tools to explore

58 indicators matching your filters
Save search
SignalLevelsEditor’s pick

Probability Grid [LuxAlgo]

by LuxAlgo

A probabilistic grid tool that visualizes potential price reversal locations using a 10x10 matrix, helping traders understand the likelihood of future market movements.

Main price chart · unverifiedScalping · Day Trading
Explore
2.5Klikes58.4Kviews13comments
Save
LevelsVolume

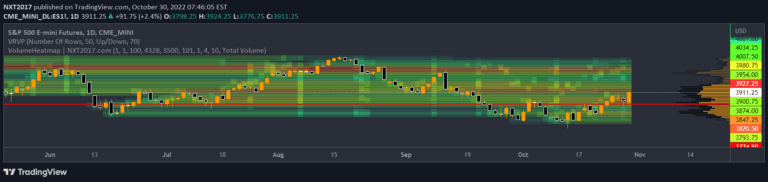
Volume Profile Matrix [LuxAlgo]

by LuxAlgo

A volume profile matrix indicator that calculates trading activity across a grid of intervals, revealing liquidity and high-volume price levels using color-coded cells.

Main price chart · unverifiedScalping · Day Trading
Explore
2.4Klikes79.1Kviews10comments
Save
TrendMomentumEditor’s pick

Polynomial Regression Bands + Channel [DW]

by DonovanWall

A polynomial regression indicator that calculates complex curve-fitting relationships between price variables, enabling advanced trend analysis and least squares moving average (LSMA) generation.

Main price chart · unverifiedDay Trading · Swing Trading
Explore
2Klikes61.6Kviews42comments
Save
TrendEditor’s pick

SMA Directional Matrix [LuxAlgo]

by LuxAlgo

A dynamic moving average panel that reveals market sentiment by displaying the direction of multiple moving averages across different time periods, helping traders understand trend dynamics.

Separate pane · unverifiedDay Trading · Swing Trading
Explore
1.9Klikes82.6Kviews23comments
Save
TrendMomentumEditor’s pick

Relative Currency Strength

by john_everist

A currency strength indicator that compares major and cross currencies relative to each other, helping traders understand underlying market dynamics and identify potential trading opportunities.

Separate pane · unverifiedDay Trading · Swing Trading
Explore
982likes18.5Kviews67comments
Save
VolumeTrendEditor’s pick

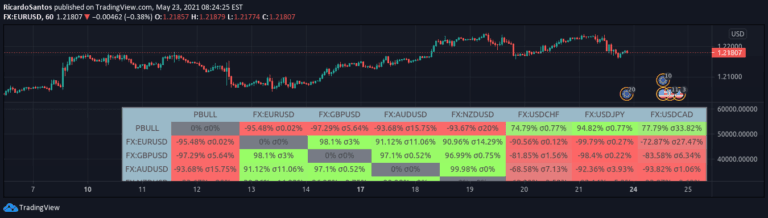
Correlation Matrix Heatmap

by RicardoSantos

A Correlation Matrix utilizes statistical tables to analyze relationships between different financial variables, helping traders understand interconnected market behaviors and potential predictive patterns.

Separate pane · unverifiedSwing Trading
Explore
854likes31.4Kviews13comments
Save

Likes, views, and comments are historical TradingView snapshots. They describe attention, not trading performance.

START WITH A QUESTION

A little less searching.
A lot more understanding.

Tell DeepAlpha what you need. Get an explanation, a shortlist,
and a direct path to the indicators behind it.

Ask DeepAlpha