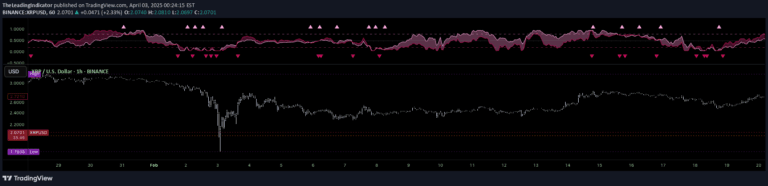
A comprehensive trading matrix that analyzes trend performance across multiple assets using customizable indicators to compare relative strength and identify top-performing investments.
Explore complementary indicator rolesHow it works
The Universal Ratio Trend Matrix calculates trend scores by comparing asset ratios using selectable indicators like RSI, CCI, and Fisher Transform. It systematically processes multiple assets, dividing each asset's price by a base price to generate comparative trend scores.
The system creates individual score arrays for each asset, then combines these into a comprehensive matrix. By applying different technical indicators, traders can flexibly assess relative performance across up to 40 different assets, with each asset receiving a score based on its trend strength relative to other assets.
Why it may be useful
This matrix provides traders with a holistic view of market performance by simultaneously analyzing multiple assets and their inter-relationships. It transforms complex comparative analysis into an easily digestible visual format, allowing investors to quickly identify which assets are outperforming or underperforming in the current market environment.
By offering a flexible, customizable approach to trend analysis, the matrix helps traders make more informed investment decisions. The ability to switch between different technical indicators enables users to adapt their analysis to changing market conditions and personal trading strategies.
When to explore it
The Universal Ratio Trend Matrix is most effective when comparing multiple assets within the same sector or across different market categories. It works best on higher timeframes like 8-hour or daily charts to minimize computational limitations and provide more stable trend assessments.
Traders should use this tool when seeking a comprehensive overview of market trends, particularly when evaluating potential portfolio allocations or comparing the relative strength of different cryptocurrencies, stocks, or other financial instruments. It is especially valuable for swing traders looking to identify broader market trends and potential investment opportunities.
Keep exploring
What we’ve verified
Access, alerts and repainting behaviour have not been independently verified for this indicator. Check the creator’s current publication and settings.
General descriptions and classifications are recovered research. Verified details above identify the specific checks we have completed. Check the creator’s current publication for later changes.