
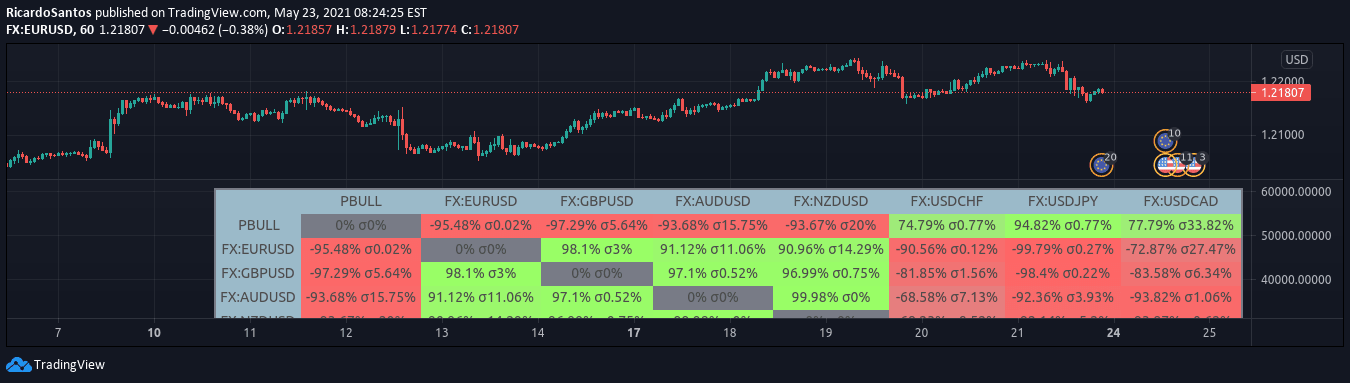
A Correlation Matrix utilizes statistical tables to analyze relationships between different financial variables, helping traders understand interconnected market behaviors and potential predictive patterns.
Explore complementary indicator rolesHow it works
A Correlation Matrix calculates statistical correlations between different financial instruments, sectors, or market variables using mathematical coefficients. It systematically compares how different assets move in relation to each other by generating numerical values between -1 and 1. Positive values indicate assets moving similarly, while negative values suggest opposite movements.
The matrix arranges these correlations in a grid format, allowing visual and numerical comparison. Traders can quickly identify which assets are strongly linked or inversely related. Complex calculations involve measuring covariance and standardizing data points to generate precise correlation coefficients
Why it may be useful
Correlation Matrices provide crucial insights into market dynamics and portfolio management strategies. They help traders diversify investments by revealing asset relationships and potential risk concentrations. Understanding correlations allows investors to construct more balanced portfolios and predict potential market movements.
These matrices can highlight hidden relationships between seemingly unrelated financial instruments. Sophisticated investors use correlation data to manage risk, optimize asset allocation, and develop more nuanced trading strategies. By quantifying market interconnectedness, traders can make more informed investment decisions
When to explore it
Correlation Matrices are most effective during complex market conditions with multiple asset classes and interconnected markets. They work exceptionally well for portfolio diversification, risk management, and long-term investment strategies. Traders should utilize these matrices when analyzing broader market trends across different sectors or international markets.
They are particularly useful during periods of economic uncertainty or significant market transitions. Institutional investors and professional traders rely on correlation analysis for comprehensive market understanding. These matrices become increasingly valuable when examining relationships between stocks, commodities, currencies, and other financial instruments
Keep exploring
What we’ve verified
Access, alerts and repainting behaviour have not been independently verified for this indicator. Check the creator’s current publication and settings.
General descriptions and classifications are recovered research. Verified details above identify the specific checks we have completed. Check the creator’s current publication for later changes.



