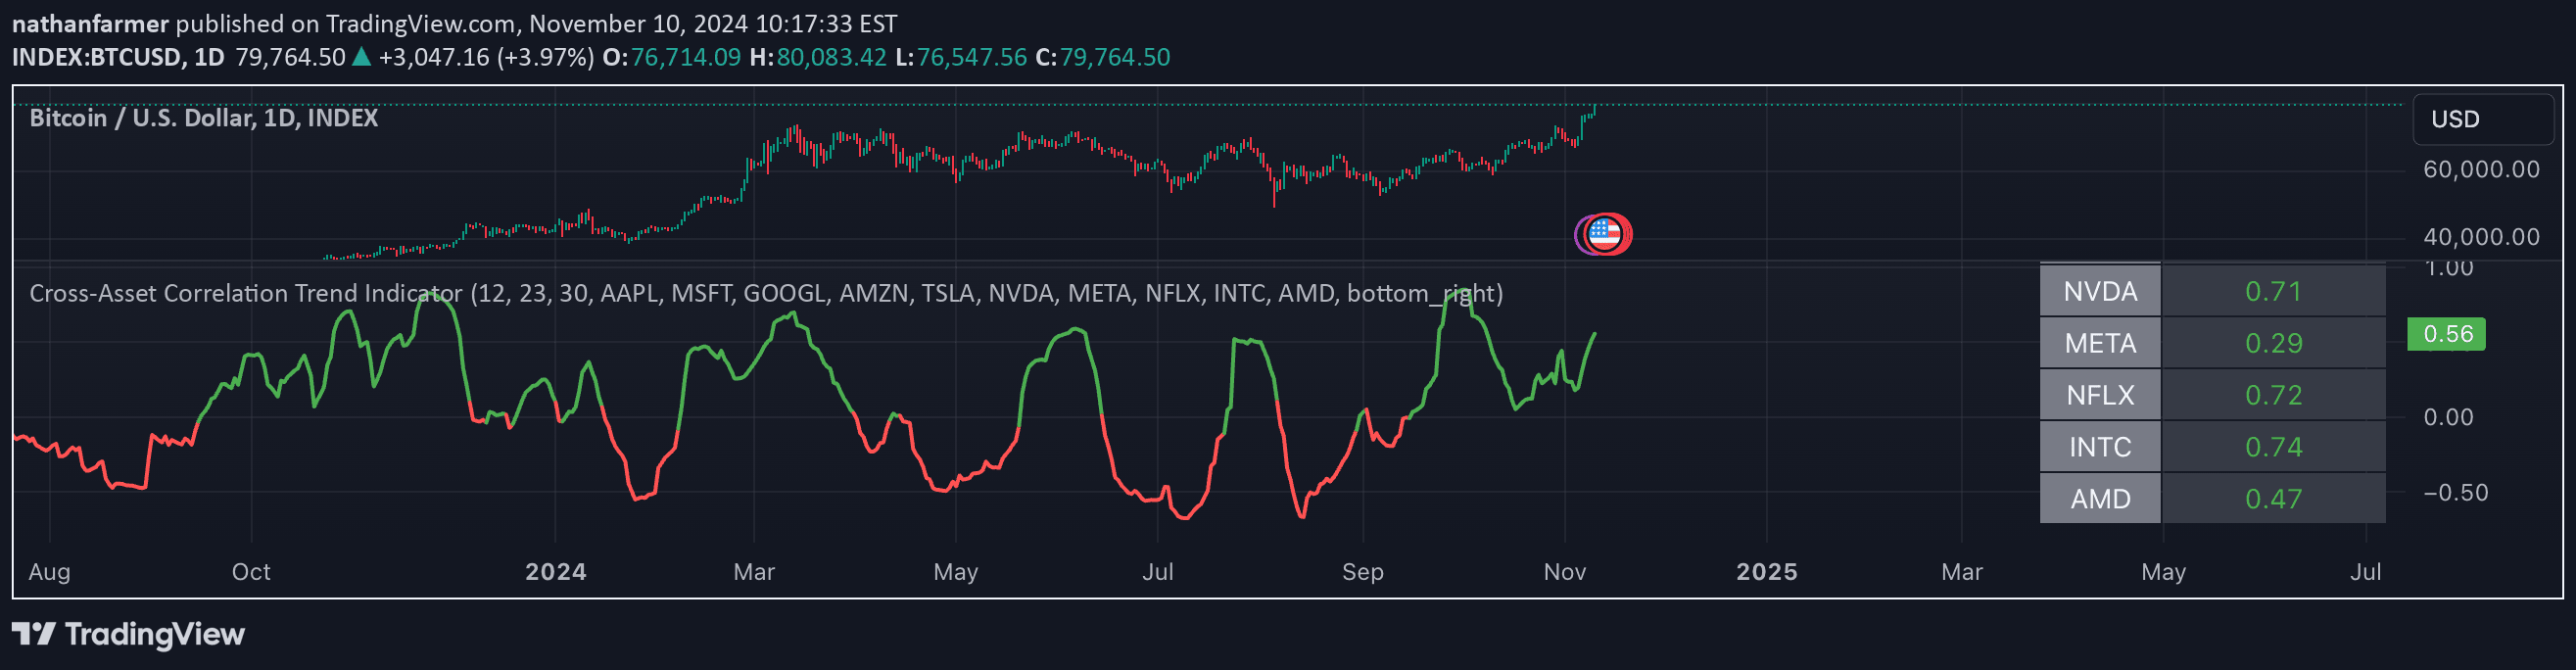
A comprehensive correlation indicator tracking relationships between major market instruments like DXY, GC, CL, ES, RTY, and ZN, providing insights into market interconnectedness and potential trading signals.
Explore complementary indicator rolesHow it works
The correlation indicator calculates and visualizes the statistical relationships between six major market instruments: DXY (US Dollar Index), GC (Gold), CL (Crude Oil), ES (S&P 500 Futures), RTY (Russell 2000 Futures), and ZN (10-Year Treasury Note Futures). By analyzing how these markets move in relation to each other, the indicator generates correlation coefficients that demonstrate the strength and direction of their interconnectedness.
Traders can customize the indicator's settings to view specific correlations or multiple correlations simultaneously. The chart displays cross-correlations, allowing users to understand complex market dynamics and potential interdependencies between different financial instruments and asset classes.
Why it may be useful
Understanding market correlations is crucial for traders seeking to optimize their investment strategies and manage portfolio risk effectively. By revealing how different financial instruments move in relation to one another, the correlation indicator provides valuable insights into potential market behaviors and interdependencies that might not be immediately apparent from individual price charts.
This tool helps traders make more informed decisions by highlighting potential systemic relationships, reducing unexpected portfolio volatility, and identifying potential hedging opportunities across different asset classes. Recognizing these correlations can significantly enhance risk management and provide a more comprehensive view of market dynamics.
When to explore it
The correlation indicator is most effective during periods of market complexity and potential systemic shifts, such as economic transitions, geopolitical events, or significant monetary policy changes. Traders can utilize this tool to gain deeper insights into market relationships during volatile or uncertain market conditions, helping them anticipate potential market movements.
It is particularly useful for multi-asset traders, portfolio managers, and sophisticated investors who require a nuanced understanding of market interconnectedness. The indicator can be especially valuable when analyzing broader market trends, evaluating portfolio diversification strategies, and identifying potential leading or lagging indicators across different financial instruments.
Keep exploring
What we’ve verified
Access, alerts and repainting behaviour have not been independently verified for this indicator. Check the creator’s current publication and settings.
General descriptions and classifications are recovered research. Verified details above identify the specific checks we have completed. Check the creator’s current publication for later changes.