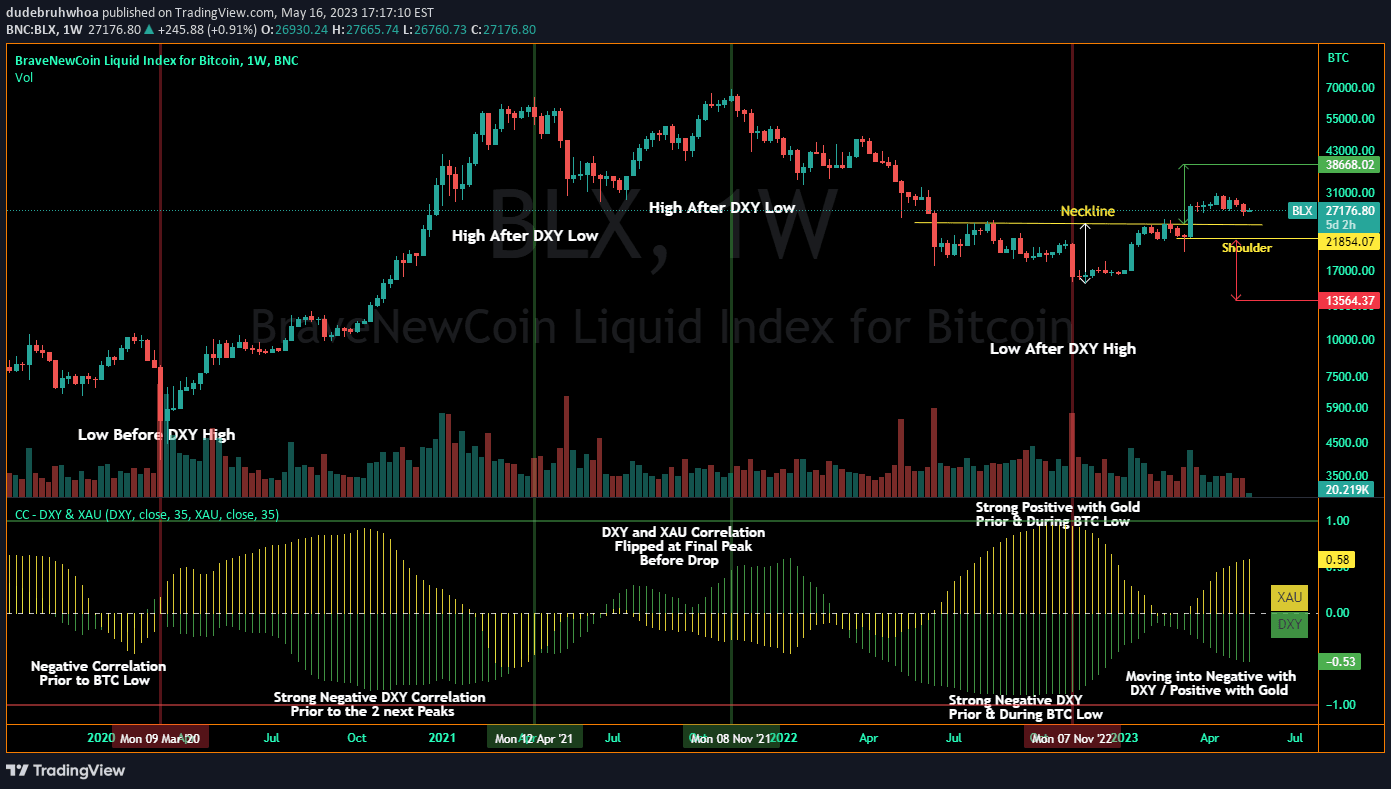
Correlation Tracker analyzes the relationship between two trading symbols, calculating their correlation strength and providing visual insights into their price movement interactions.
Explore complementary indicator rolesHow it works
The Correlation Tracker calculates the correlation between two financial symbols using a Pearson correlation coefficient across a specified lookback period. It transforms the raw correlation value into a normalized scale from 0 to 1, making it easier for traders to interpret the relationship between the symbols.
The indicator generates a visual representation of the correlation through a color-coded line and a table display. By leveraging a logarithmic scale calculation, the tracker provides a balanced and accurate measure of correlations, particularly effective on longer timeframe charts like weekly intervals.
Why it may be useful
Understanding symbol correlations is crucial for traders seeking to diversify their portfolios, manage risk, and identify potential market relationships. By revealing how different assets move in relation to each other, traders can make more informed decisions about asset allocation and potential hedging strategies.
The Correlation Tracker offers a sophisticated yet accessible method to quantify complex market interactions. Its normalized scale and descriptive labels help traders quickly grasp the strength and nature of correlations, enabling more nuanced trading approaches and risk management techniques.
When to explore it
The Correlation Tracker is most effective when analyzing relationships between different financial instruments, such as stocks, indices, commodities, or currencies. Traders can use this tool to identify potential diversification opportunities, understand market dynamics, and develop more robust trading strategies.
It is particularly valuable during periods of market complexity or when exploring potential correlations between seemingly unrelated assets. By providing clear, quantifiable insights into symbol relationships, the indicator helps traders make more informed decisions across various trading timeframes and market conditions.
Keep exploring
What we’ve verified
Access, alerts and repainting behaviour have not been independently verified for this indicator. Check the creator’s current publication and settings.
General descriptions and classifications are recovered research. Verified details above identify the specific checks we have completed. Check the creator’s current publication for later changes.