Optimized Trend Tracker
Optimized Trend Tracker (OTT) is an advanced indicator designed to identify market trend direction and provide clear buy and sell signals based on price movements relative to the indicator line.
Explore 11,183 indicators. Filter beyond the obvious.
Discover the tools that fit the way you trade.
11,183 tools to explore
Optimized Trend Tracker (OTT) is an advanced indicator designed to identify market trend direction and provide clear buy and sell signals based on price movements relative to the indicator line.
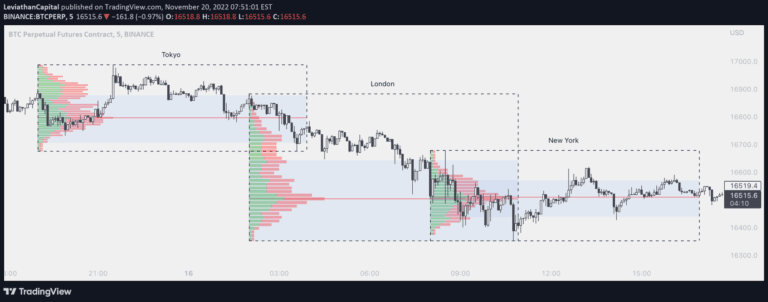
A comprehensive forex market session tracker with Volume Profile analysis that allows traders to visualize trading activity across different global market sessions and timeframes.
A customizable market session tracker displaying trading hours for Tokyo, London, New York, and Sydney with multiple visualization options and advanced trading insights.
ICT Algorithmic Macro Tracker plots key trading time windows based on Inner Circle Trader methodology, helping traders identify potential market movement periods across specific time intervals.
A trading tool that tracks cumulative buy and sell volumes across different time periods, providing visual insights into market participant behavior and volume dynamics.
Progressive Trend Tracker is a dynamic Bollinger Bands variant using Highest Highs and Lowest Lows to generate precise trading signals with VIDYA moving average.
Multiple OTT (MOTT) is an advanced trend tracking indicator with five dynamic lines that help identify potential market movements and support/resistance levels.
OTT is a versatile trend-following indicator that tracks price movements using a sophisticated mathematical construct, offering multiple adaptable systems for trend detection and signal generation.
A precision market structure tool using Fibonacci retracements and Smart Money Concepts to identify optimal entry zones during trending markets with high-probability structural shifts.
A higher timeframe trend tracking indicator that dynamically identifies market trends, key levels, and sentiment through color-coded visual representations of price action.
A real-time portfolio tracking tool in TradingView that allows traders to monitor up to 10 holdings and cash position, providing visual insights into investment performance directly on the chart.
A comprehensive trading script enabling portfolio management and performance analysis with customizable settings for instrument selection, capital allocation, and benchmark comparison.
Likes, views, and comments are historical TradingView snapshots. They describe attention, not trading performance.