YOUR INDICATOR RESEARCH STARTS HERE

Find the right indicator.
Understand what it does.

Explore 11,183 indicators. Filter beyond the obvious.
Discover the tools that fit the way you trade.

THE INDICATOR LIBRARY

Results for “correlations”

11,183 tools to explore

201 indicators matching your filters
Save search
MomentumTrendVolatility

Multi-Chart Widget [LuxAlgo]

by LuxAlgo

A multi-chart analysis tool enabling traders to simultaneously view multiple financial instruments, technical indicators, and performance metrics across different timeframes.

Main price chart · unverifiedScalping · Day Trading
Explore
3.3Klikes46.1Kviews22comments
Save
TrendEditor’s pick

Previous Period Levels - X Alerts

by JayRogers

A customizable higher time-frame OHLC indicator that provides flexible visual references across multiple resolutions with advanced input options and alert conditions.

Main price chart · unverifiedSwing Trading
Explore
2.5Klikes69.2Kviews56comments
Save
SignalTrend

Swing Structure Scanner [LuxAlgo]

by LuxAlgo

A multi-ticker dashboard that visually tracks swing structures across different timeframes, helping traders identify potential trend formations and market confluence.

Separate pane · unverifiedDay Trading · Swing Trading
Explore
2.3Klikes54.8Kviews9comments
Save
TrendVolatilityEditor’s pick

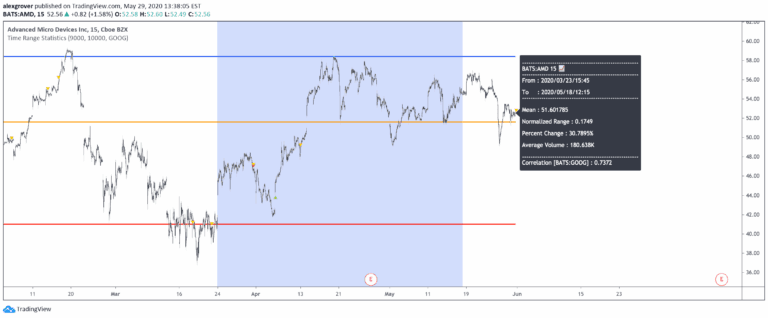
Time Range Statistics

by alexgrover

A comprehensive trading script that calculates various price statistics within a user-selected range, offering insights into price movement, volatility, and market trends through statistical analysis.

Main price chart · unverifiedDay Trading · Swing Trading
Explore
1.1Klikes36.4Kviews16comments
Save
VolatilityEditor’s pick

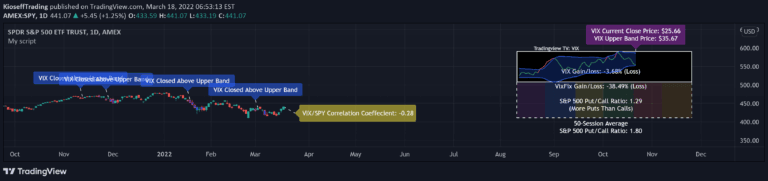
VIX Cheat Sheet

by KioseffTrading

A VIX-based indicator that analyzes volatility correlation with asset prices, tracking VIX/VixFix movements and calculating potential market performance after specific volatility conditions.

Main price chart · unverifiedDay Trading · Swing Trading
Explore
1.1Klikes65.5Kviews32comments
Save
LevelsSignalVolatility

ICT Asian Range and Killzones

by ICTFusion

A trading session indicator that highlights key market windows like Asian Range and London/New York Killzones, providing visual insights into potential trading ranges and market activity levels.

Main price chart · unverifiedScalping · Day Trading
Explore
964likes21.8Kviews4comments
Save
VolumeTrendEditor’s pick

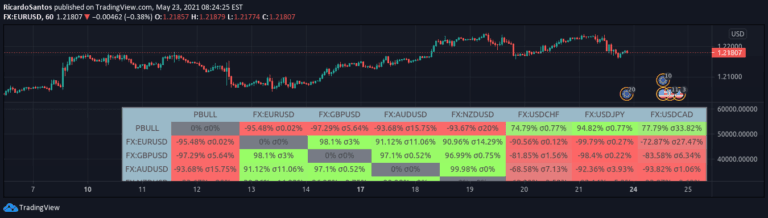
Correlation Matrix Heatmap

by RicardoSantos

A Correlation Matrix utilizes statistical tables to analyze relationships between different financial variables, helping traders understand interconnected market behaviors and potential predictive patterns.

Separate pane · unverifiedSwing Trading
Explore
854likes31.4Kviews13comments
Save

Likes, views, and comments are historical TradingView snapshots. They describe attention, not trading performance.

START WITH A QUESTION

A little less searching.
A lot more understanding.

Tell DeepAlpha what you need. Get an explanation, a shortlist,
and a direct path to the indicators behind it.

Ask DeepAlpha