A comprehensive trading script that calculates various price statistics within a user-selected range, offering insights into price movement, volatility, and market trends through statistical analysis.
Explore complementary indicator rolesHow it works
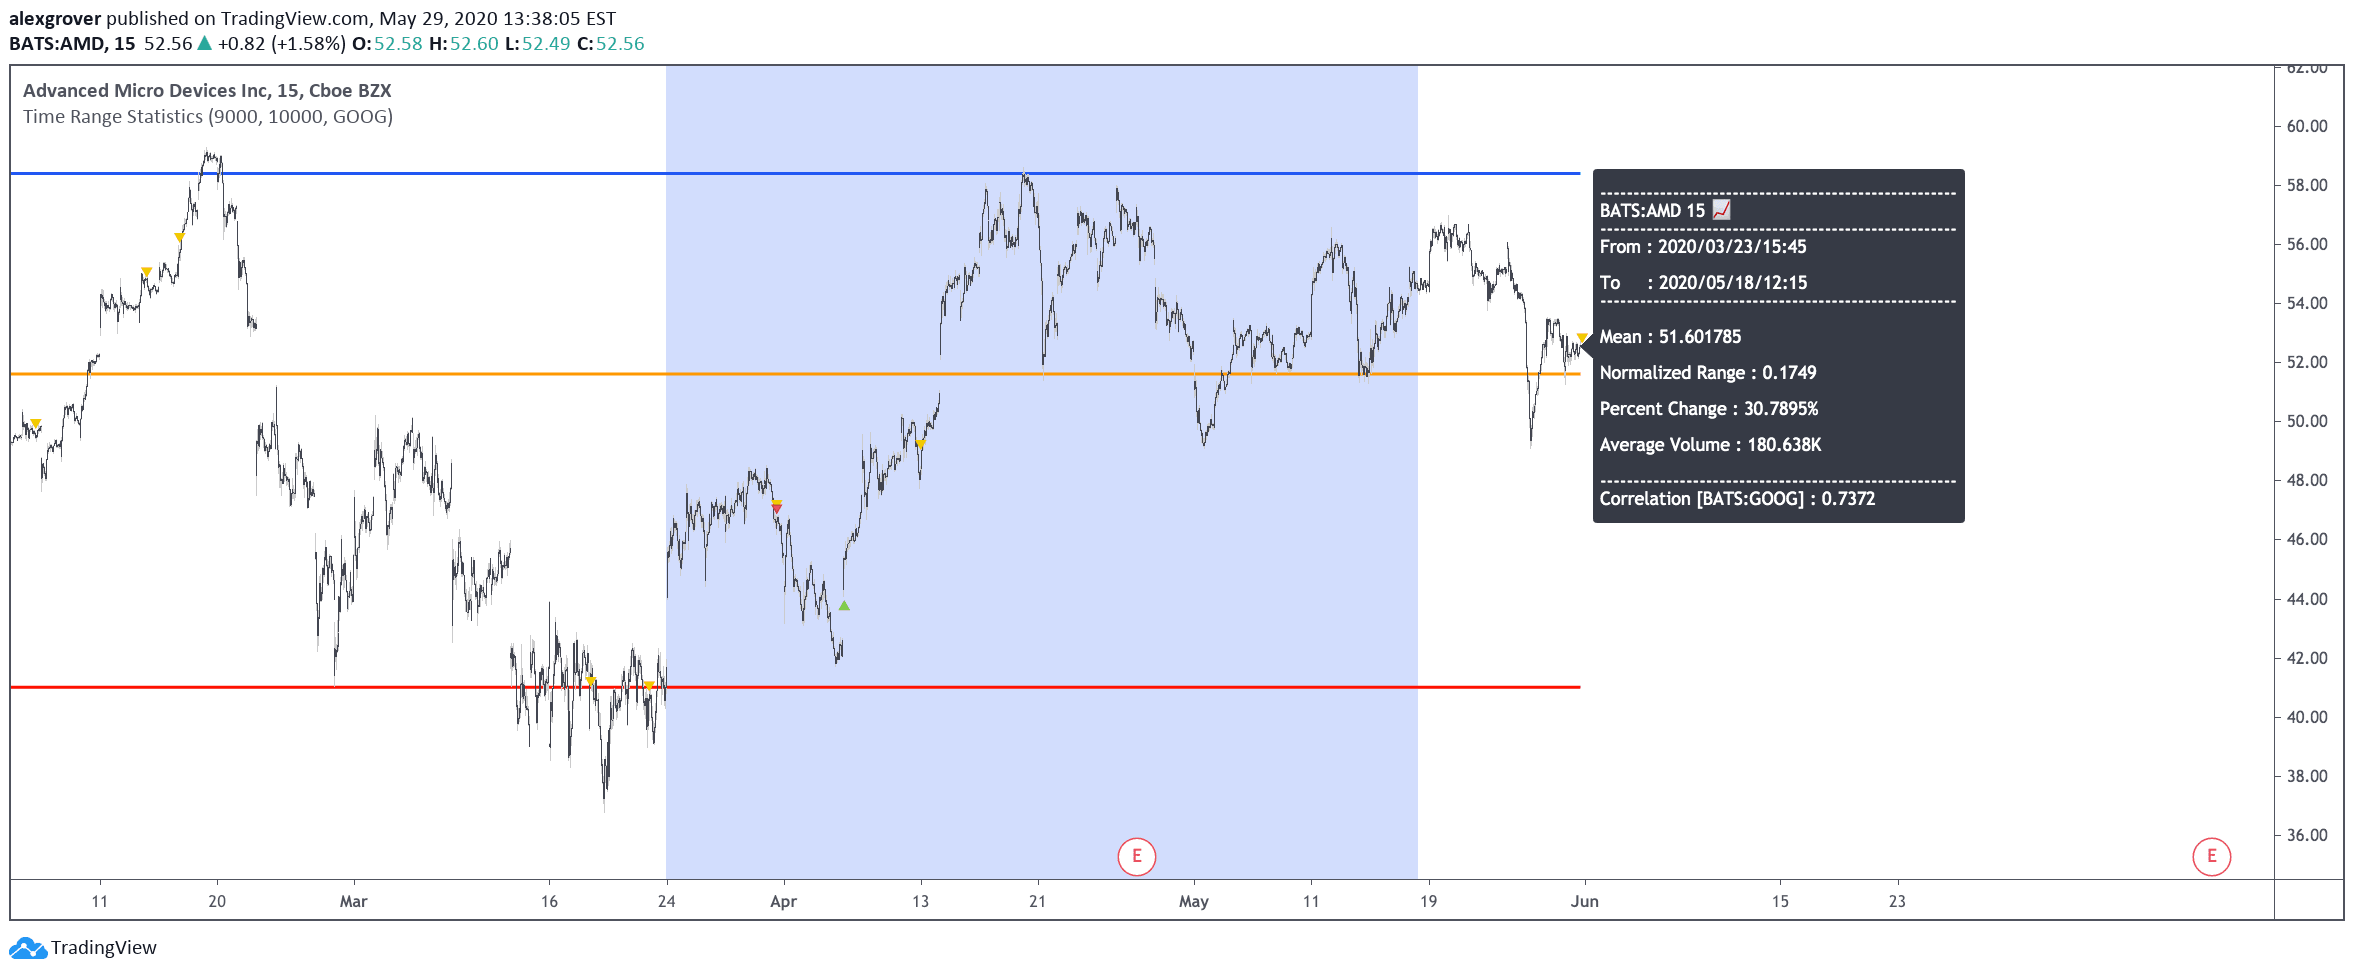
The script allows users to select a specific price range and calculates multiple statistical metrics including mean price, normalized range, percentage change, and average traded volume. It highlights the selected range on the chart and displays a panel with key statistics.
The script determines overall market trends by comparing higher highs and lower lows. It also calculates the correlation between closing prices of the selected instrument and another user-defined instrument, providing comprehensive market insights
Why it may be useful
Traders benefit from this script by gaining a deeper understanding of price behavior within specific market periods. The normalized range provides a standardized measure of price variation, making it easier to compare different instruments.
The correlation analysis helps identify relationships between different market instruments. By offering multiple statistical perspectives, traders can make more informed decisions, understand market dynamics, and potentially identify trading opportunities based on price movement patterns and statistical relationships
When to explore it
This script is most effective when analyzing specific market periods with significant price movements or during complex market conditions. It works best for traders seeking detailed statistical insights rather than simple trend indicators.
Ideal for analyzing market transitions, comparing different market segments, and understanding price behavior across various timeframes. Particularly useful when evaluating potential trading strategies, assessing market volatility, and identifying potential correlations between different financial instruments
Keep exploring
What we’ve verified
Access, alerts and repainting behaviour have not been independently verified for this indicator. Check the creator’s current publication and settings.
General descriptions and classifications are recovered research. Verified details above identify the specific checks we have completed. Check the creator’s current publication for later changes.