YOUR INDICATOR RESEARCH STARTS HERE

Find the right indicator.
Understand what it does.

Explore 11,183 indicators. Filter beyond the obvious.
Discover the tools that fit the way you trade.

THE INDICATOR LIBRARY

Results for “INFO”

11,183 tools to explore

36 indicators matching your filters
Save search
TrendVolatilityEditor’s pick

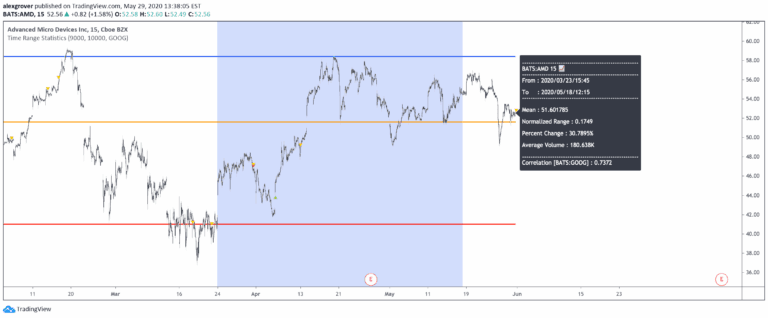
Time Range Statistics

by alexgrover

A comprehensive trading script that calculates various price statistics within a user-selected range, offering insights into price movement, volatility, and market trends through statistical analysis.

Main price chart · unverifiedDay Trading · Swing Trading
Explore
1.1Klikes36.4Kviews16comments
Save
TrendEditor’s pick

TA Information Panel

by RicardoSantos

A multiple information panel using tables provides traders with comprehensive visual data representations across various trading metrics, enabling quick and efficient analysis of complex market information.

Separate pane · unverifiedDay Trading · Swing Trading
Explore
1.1Klikes27.2Kviews8comments
Save
MomentumOscillator

RSI MTF Panel [xdecow]

by xdecow

A versatile RSI indicator that allows traders to analyze multiple timeframes simultaneously with customizable visual settings and trend identification parameters.

Separate pane · unverifiedScalping · Day Trading
Explore
536likes11Kviews3comments
Save
TrendSignal

MA Band Distance Monitor

by HasanRifat

A trading indicator that plots two moving averages and measures their distance from current price, helping traders assess trend strength and potential entry/exit points.

Main price chart · unverifiedDay Trading · Swing Trading
Explore
481likes10.1Kviews10comments
Save
MomentumOscillatorSignal

Hybrid Overbought/Oversold Overlay

by informanerd

A hybrid indicator combining 12 different oscillators to detect overbought and oversold conditions by normalizing and analyzing multiple technical indicators simultaneously.

Separate pane · unverifiedScalping · Day Trading
Explore
480likes9.9Kviews9comments
Save
MomentumSignalVolume

Stop Cascade Detector

by DskyzInvestments

A trading tool that detects stop-loss cascades by analyzing price momentum and volume spikes, revealing potential market turning points and explosive price movements.

Main price chart · unverifiedScalping · Day Trading
Explore
426likes6.3Kviews4comments
Save
SignalVolatility

Candle size in pips

by Anrazzi

A trading tool that measures candle range in pips, helping traders identify potential entry points by analyzing price movement and volatility within specific market conditions.

Main price chart · unverifiedScalping · Day Trading
Explore
273likes8.2Kviews21comments
Save

Likes, views, and comments are historical TradingView snapshots. They describe attention, not trading performance.

START WITH A QUESTION

A little less searching.
A lot more understanding.

Tell DeepAlpha what you need. Get an explanation, a shortlist,
and a direct path to the indicators behind it.

Ask DeepAlpha