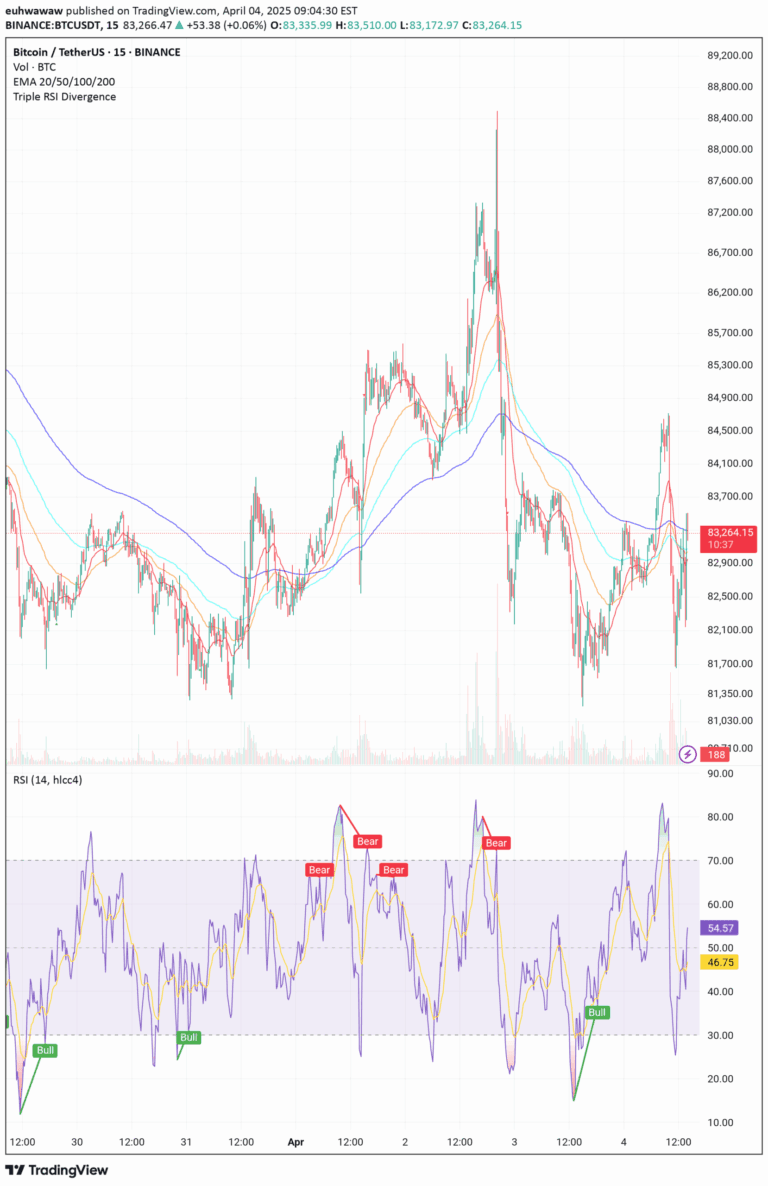
A versatile RSI indicator that allows traders to analyze multiple timeframes simultaneously with customizable visual settings and trend identification parameters.
Explore complementary indicator rolesHow it works
The RSI indicator calculates the relative strength index by measuring the magnitude of recent price changes to evaluate overbought or oversold conditions. It compares upward and downward price movements within a specified timeframe, generating a momentum oscillator that ranges between 0 and 100.
This multi-timeframe RSI allows traders to configure up to 10 different timeframes simultaneously, with customizable length and source settings. By displaying RSI values across various periods, traders can gain comprehensive insights into market momentum and potential trend reversals.
Why it may be useful
The multi-timeframe RSI provides traders with a nuanced view of market momentum across different trading periods, enabling more informed decision-making. By offering visual customization and flexible configuration, the indicator helps traders quickly identify potential trend changes and market sentiment.
Traders can leverage the indicator's advanced features like color-coded zones and comprehensive panel settings to enhance their technical analysis. The ability to simultaneously monitor multiple timeframes reduces the risk of missing critical momentum shifts and improves overall trading strategy precision.
When to explore it
The multi-timeframe RSI is most effective during trending and ranging market conditions, offering insights into potential trend reversals and momentum shifts. Traders can utilize this indicator when seeking to confirm price movements, identify overbought or oversold conditions, and assess market strength across different timeframes.
The indicator is particularly useful for traders who want a comprehensive view of market momentum, combining multiple analytical perspectives into a single, customizable tool. It excels in providing context and depth to technical analysis, helping traders make more informed decisions across various trading styles and market environments.
Keep exploring
What we’ve verified
Access, alerts and repainting behaviour have not been independently verified for this indicator. Check the creator’s current publication and settings.
General descriptions and classifications are recovered research. Verified details above identify the specific checks we have completed. Check the creator’s current publication for later changes.