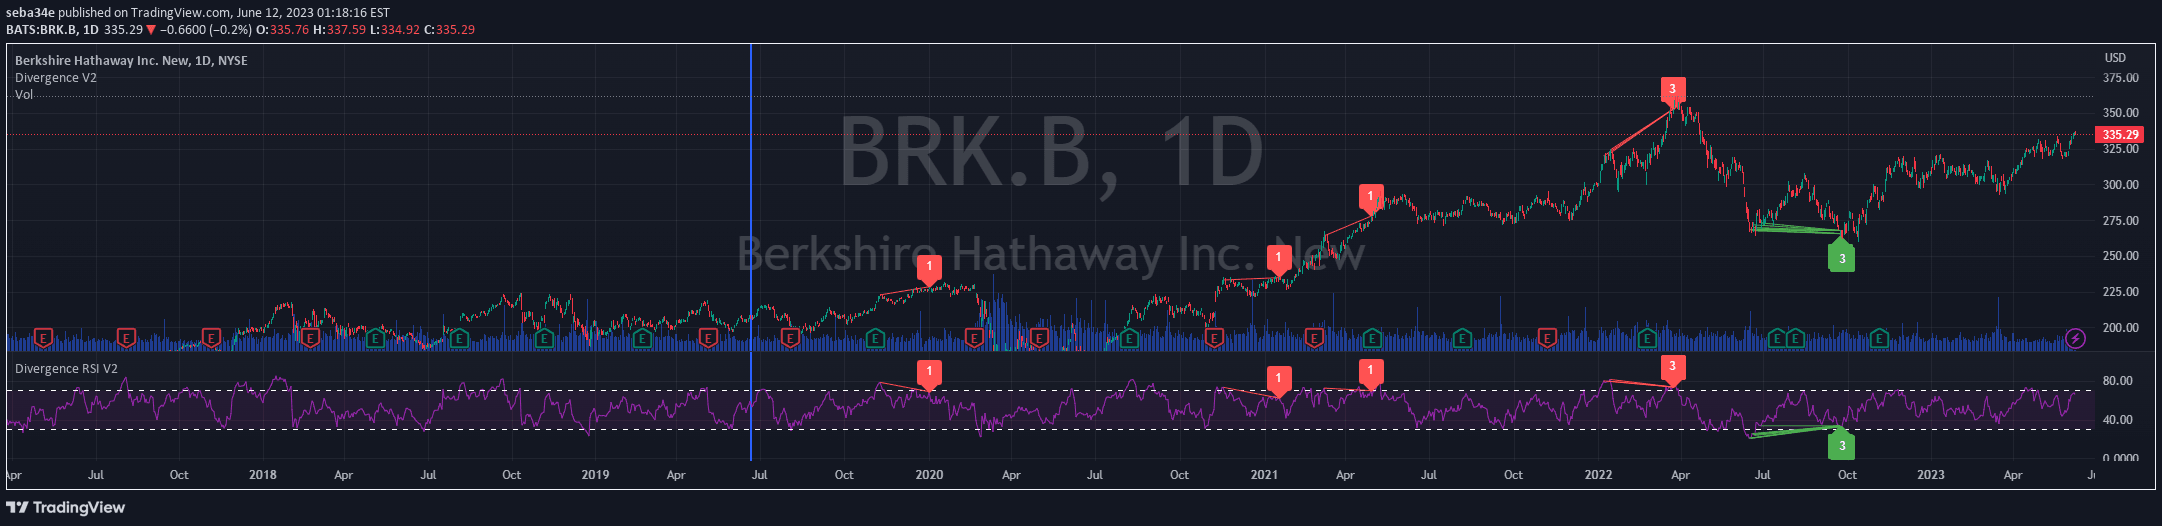
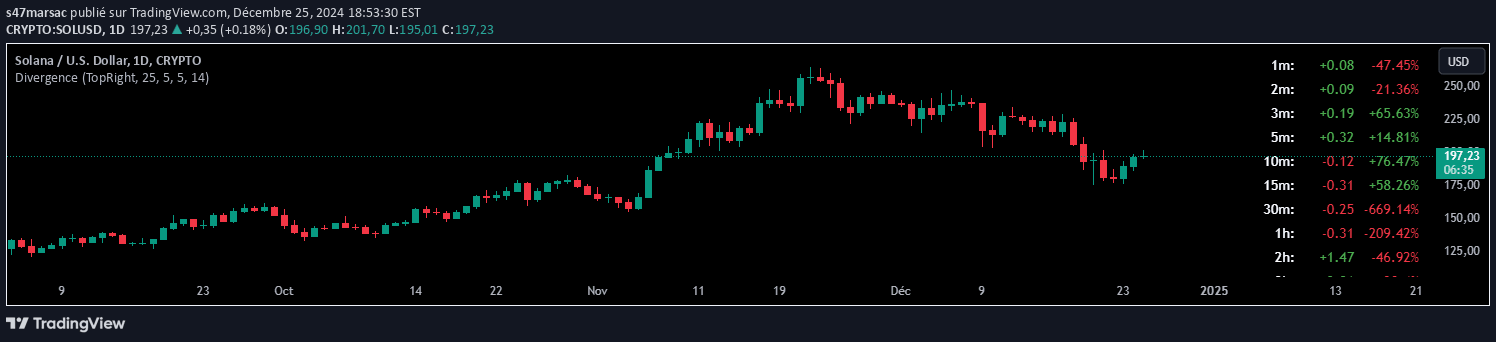
Triple RSI Divergence is a technical analysis method that identifies potential trend reversals by comparing price action and RSI movement across three consecutive points.
Explore complementary indicator rolesHow it works
The triple RSI divergence strategy calculates the 14-period Relative Strength Index (RSI) and identifies three recent price highs or lows. It compares price movement with corresponding RSI values to detect momentum shifts.
In a bearish scenario, price creates three consecutive higher highs while RSI forms lower highs, signaling potential trend reversal. Conversely, in a bullish scenario, price makes three lower lows while RSI forms higher lows. This method requires precise tracking of both price and RSI patterns to confirm divergence
Why it may be useful
Triple RSI divergence is crucial for traders because it provides early warning signals of potential trend reversals. By revealing discrepancies between price action and momentum, it helps traders anticipate market turning points before they fully manifest.
This strategy offers deeper insights than traditional single-point divergence analysis. It allows traders to identify weakening trends and potential trend exhaustion. The method combines price and momentum analysis for more comprehensive market assessment
When to explore it
Triple RSI divergence works best in trending markets with clear directional movements. It is most effective on longer timeframes like daily or weekly charts where trend dynamics are more pronounced. Traders should use this signal in conjunction with other technical indicators for confirmation.
It is particularly useful during ranging or consolidating market conditions. The strategy performs well across various financial instruments, including stocks, forex, and cryptocurrencies. Optimal results are achieved when combined with additional trend and momentum confirmation tools
Keep exploring
What we’ve verified
Access, alerts and repainting behaviour have not been independently verified for this indicator. Check the creator’s current publication and settings.
General descriptions and classifications are recovered research. Verified details above identify the specific checks we have completed. Check the creator’s current publication for later changes.