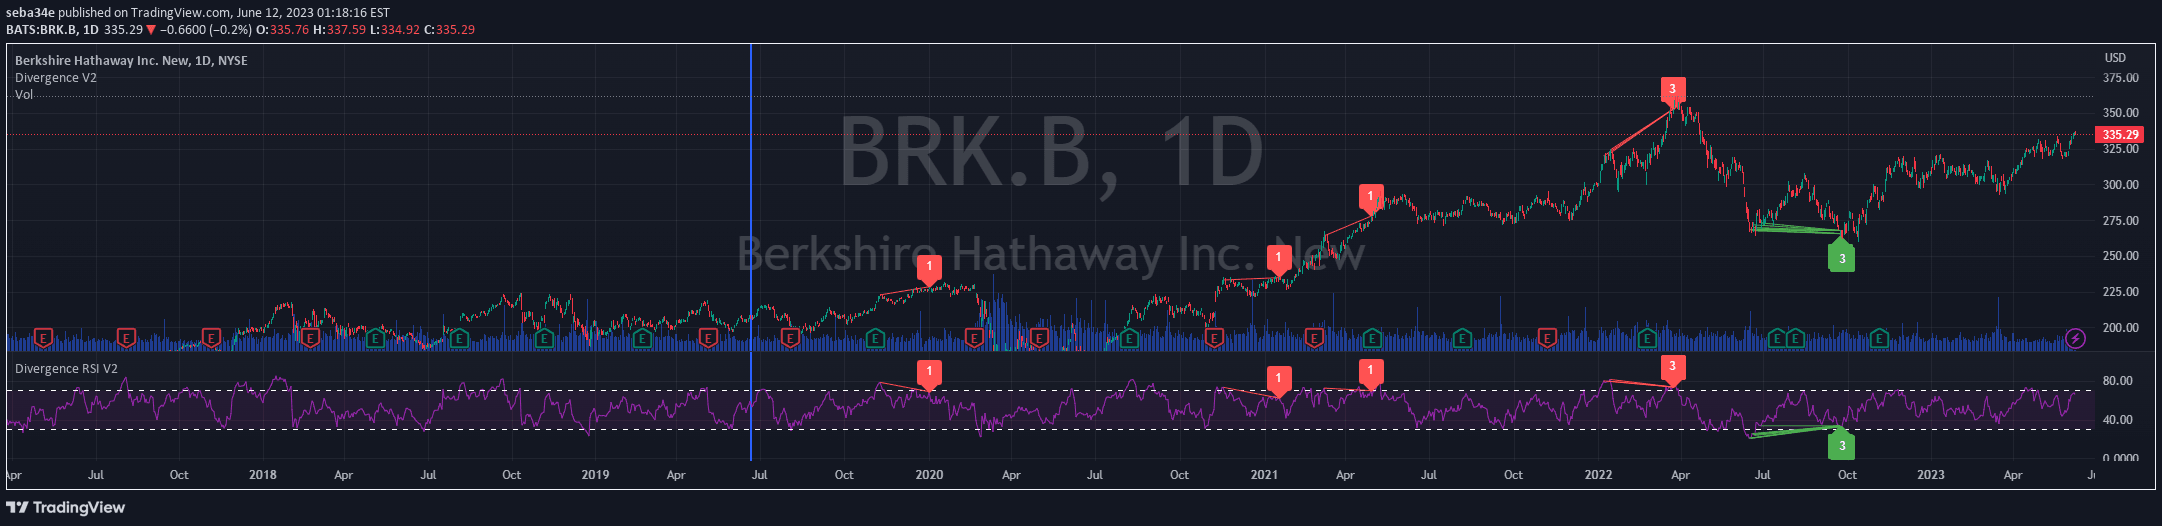
RSI Divergence indicator that identifies three types of divergences between price and RSI, highlighting potential trend reversals and continuations using color-coded visual signals.
Explore complementary indicator rolesHow it works
The RSI Divergence indicator calculates the Relative Strength Index using a customizable length and automatically matches the chart's timeframe. It identifies pivot highs and lows on both price and RSI by analyzing a specified number of left and right bars, detecting points where price and momentum diverge.
The indicator then classifies these divergences into three types: regular divergences signaling potential trend reversals, hidden divergences suggesting trend continuation, and exaggerated divergences indicating significant momentum shifts. Each divergence is visually represented with colored lines and labels on the RSI panel, using green for bullish and red for bearish signals.
Why it may be useful
RSI Divergence helps traders gain deeper insights into market momentum and potential trend changes by revealing discrepancies between price action and underlying momentum. By highlighting moments where price and RSI move differently, traders can anticipate potential reversals or continuation patterns before they become obvious on the price chart.
The indicator's ability to differentiate between regular, hidden, and exaggerated divergences provides traders with nuanced information about market dynamics. This comprehensive approach allows for more refined decision-making, helping traders identify potential entry and exit points with greater precision and confidence.
When to explore it
RSI Divergence is most effective in markets with clear trending or range-bound characteristics, where momentum and price movements can be analyzed systematically. It works particularly well in timeframes that allow sufficient pivot points to be identified, typically on daily, 4-hour, and 1-hour charts where patterns are more reliable.
Traders should use this indicator in conjunction with other technical analysis tools to confirm signals and reduce false positives. It is especially useful during periods of market transition, when traditional price action might not fully reveal underlying momentum shifts, making it valuable for traders seeking to anticipate potential trend changes before they fully manifest.
Keep exploring
What we’ve verified
Access, alerts and repainting behaviour have not been independently verified for this indicator. Check the creator’s current publication and settings.
General descriptions and classifications are recovered research. Verified details above identify the specific checks we have completed. Check the creator’s current publication for later changes.