Mandelbrot-Fibonacci Cascade Vortex (MFCV)
A complex trading indicator combining Mandelbrot's fractal theory and Fibonacci sequences to analyze market dynamics, revealing hidden mathematical patterns in price movements.
Explore 11,183 indicators. Filter beyond the obvious.
Discover the tools that fit the way you trade.
11,183 tools to explore
A complex trading indicator combining Mandelbrot's fractal theory and Fibonacci sequences to analyze market dynamics, revealing hidden mathematical patterns in price movements.
A trading tool that detects stop-loss cascades by analyzing price momentum and volume spikes, revealing potential market turning points and explosive price movements.
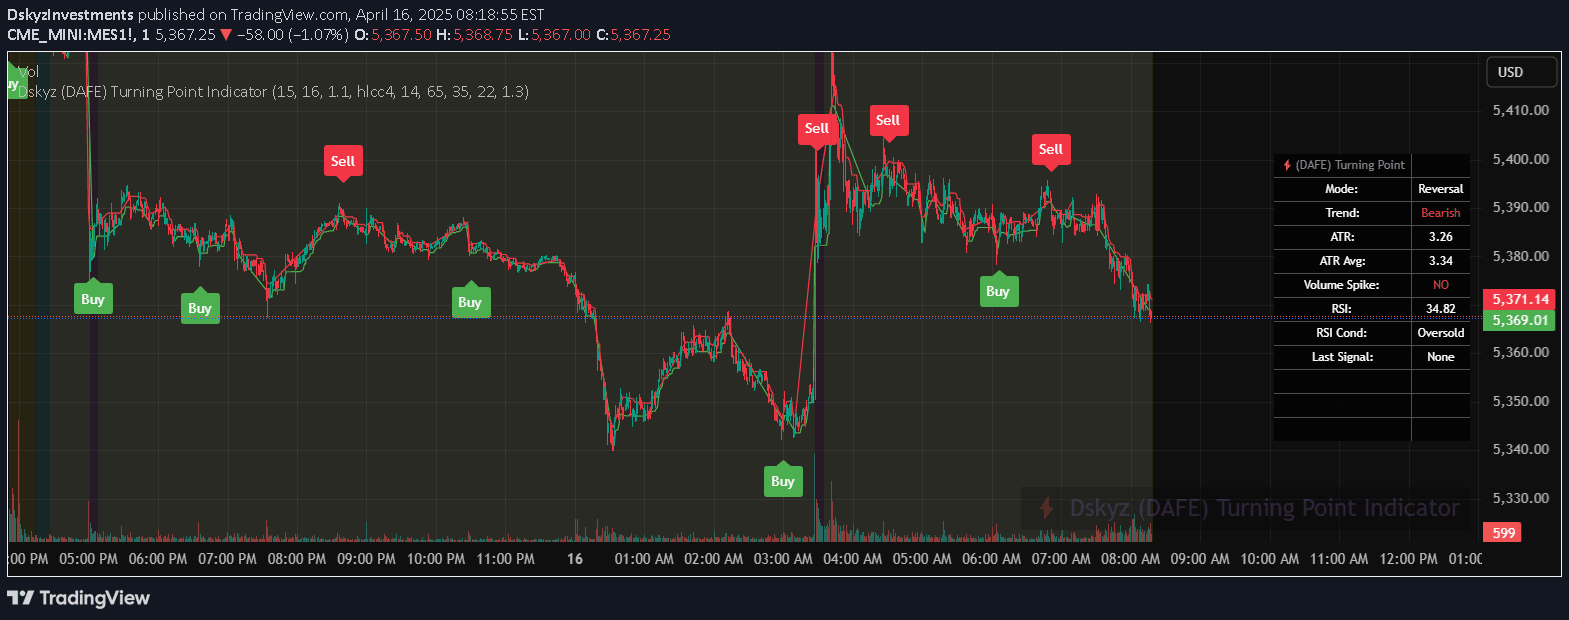
A smart reversal detection system that combines trend direction, volatility, price action, and advanced filtering to identify key market turning points with high accuracy.
A sophisticated trading signal using Lorentzian geometry to analyze market patterns by measuring complex similarities between historical market states and current conditions.
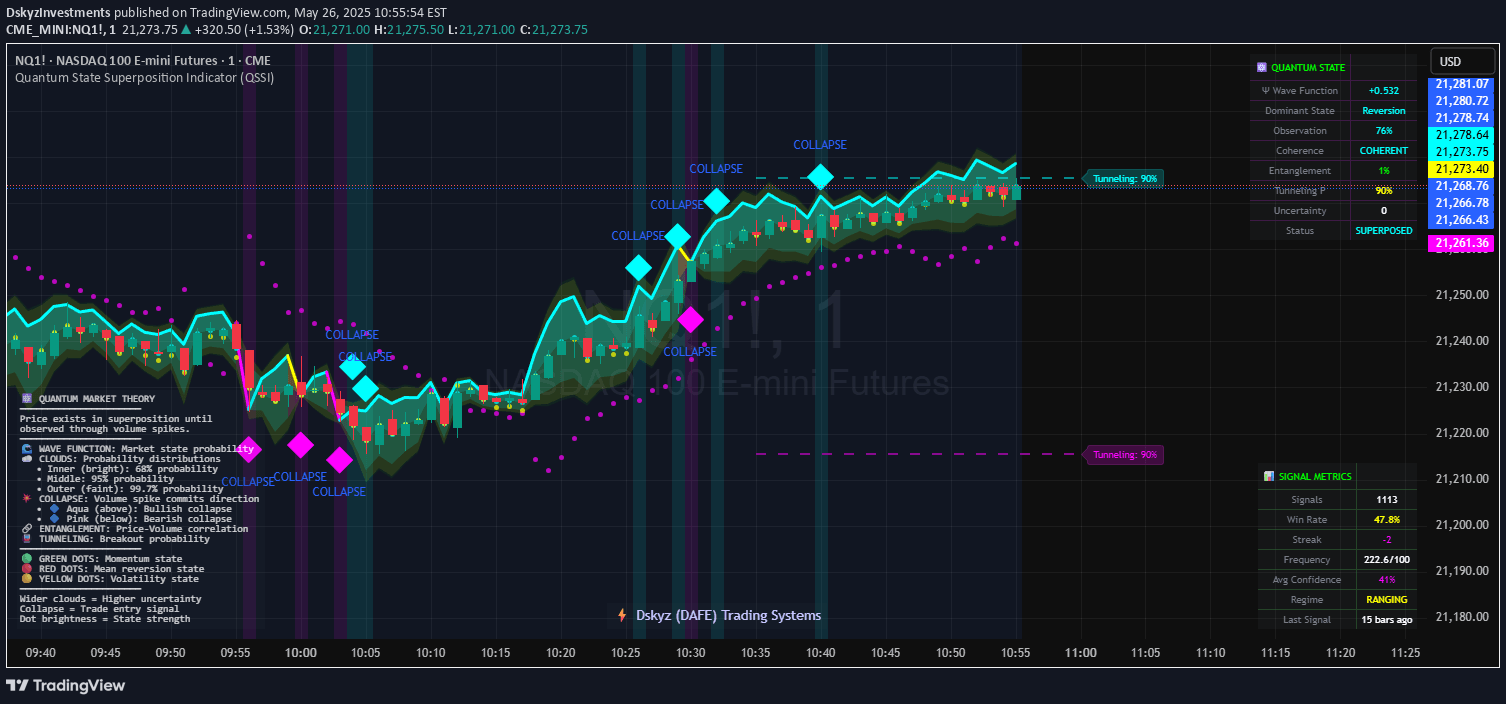
A quantum mechanics-inspired trading indicator that models market states probabilistically, analyzing price action through wave function collapse and quantum state superposition principles.
A momentum indicator that reveals market aggression by analyzing order flow pressure, using a centered gauge bar to visually display buying and selling intent.
A spectral analysis tool that reveals market order flow resonance by extracting dominant frequencies and detecting market regime shifts using advanced mathematical techniques.
Ergodic Market Divergence applies statistical physics to trading, analyzing market states and identifying regime shifts using ensemble analysis and adaptive confidence scoring.
A revolutionary mathematical approach to market analysis using category theory and homotopy type theory to reveal hidden market structures and transform trading strategy.
Lyapunov Market Instability uses chaos theory to analyze market dynamics, revealing whether markets are trending or ranging by measuring trajectory divergence and regime changes.
The Retail Pain Index is a behavioral volatility tool that measures market stress by tracking how far price moves from the average entry zone, revealing potential trading opportunities.
A sophisticated volatility analysis tool that detects market regime shifts by measuring the deviation of volatility itself, revealing potential market breakouts before traditional indicators.
Likes, views, and comments are historical TradingView snapshots. They describe attention, not trading performance.