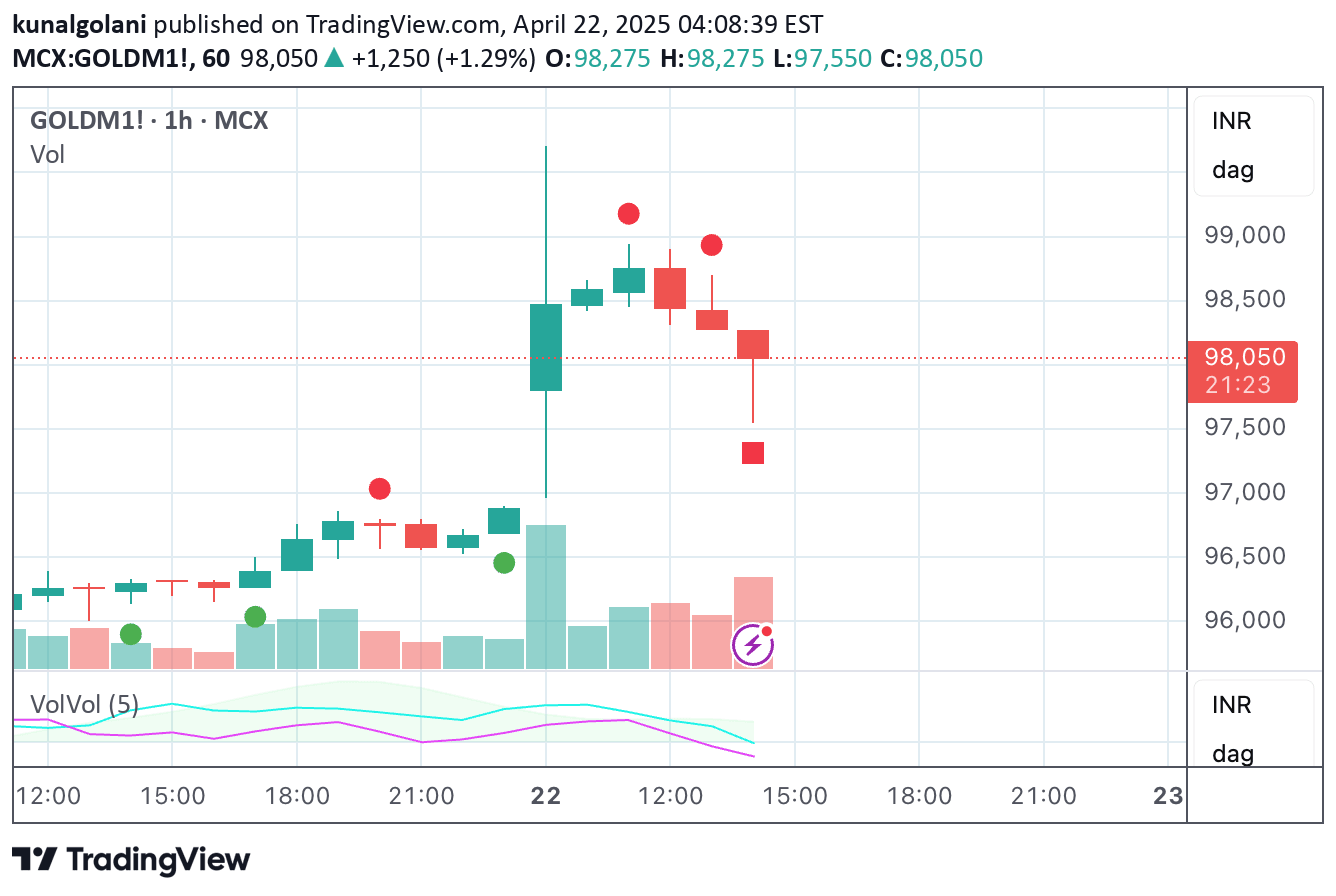
A sophisticated volatility analysis tool that detects market regime shifts by measuring the deviation of volatility itself, revealing potential market breakouts before traditional indicators.
Explore complementary indicator rolesHow it works
Deviation over Deviation (DoD) operates by calculating the Z-score of volatility, essentially measuring how unusual the current market volatility is compared to its historical context. It uses a complex multi-timeframe comparative engine that analyzes volatility across different time horizons, allowing traders to detect subtle changes in market behavior.
The system integrates VoVix (volatility of volatility) to provide an even more nuanced view of market dynamics. By comparing current and higher timeframe DoD Z-scores, the indicator can highlight moments when market volatility is about to transition, revealing potential regime shifts before they become apparent through traditional analysis methods.
Why it may be useful
Traditional volatility indicators often show market movements after they've already occurred, leaving traders reacting to past events instead of anticipating future changes. DoD breaks this cycle by providing a forward-looking perspective on market volatility, allowing traders to identify potential breakouts and regime shifts before they fully manifest.
By revealing the hidden structure of market volatility, this tool offers traders a strategic advantage in understanding market dynamics. It transforms volatility analysis from a retrospective exercise into a predictive mechanism, enabling more proactive trading decisions and potentially improving entry and exit timing.
When to explore it
DoD is most effective during periods of market transition, such as before significant economic announcements, during emerging trend changes, or when asset volatility seems unusually compressed. Traders can use this tool to detect potential breakout moments across various market conditions and timeframes.
The indicator is particularly powerful when combined with other analytical tools, serving as a confirmation signal or early warning system. It works best for traders who are seeking to understand underlying market dynamics beyond simple price movement, and who want to anticipate potential volatility explosions before they occur.
Keep exploring
What we’ve verified
Access, alerts and repainting behaviour have not been independently verified for this indicator. Check the creator’s current publication and settings.
General descriptions and classifications are recovered research. Verified details above identify the specific checks we have completed. Check the creator’s current publication for later changes.