Support and Resistance (High Volume Boxes) [ChartPrime]
A volume-based support and resistance indicator that identifies key trading levels through pivot points and volume analysis, providing visual cues for potential price reversals.
Explore 11,183 indicators. Filter beyond the obvious.
Discover the tools that fit the way you trade.
11,183 tools to explore
A volume-based support and resistance indicator that identifies key trading levels through pivot points and volume analysis, providing visual cues for potential price reversals.
A trading indicator that uses pivot points to identify supply and demand zones, market structure, and potential trading opportunities through visual analysis of price action.
A volume profile indicator that visualizes trading volume across different time frames using lines and boxes, providing unique insights into volume distribution and market activity.
Advanced volume analysis tool that creates a heatmap and volume profile, providing detailed insights into trading volume, price movements, and market structure across different time frames.
Bullish Percent Index measures the percentage of securities on Point & Figure buy signals, providing a breadth indicator for market sentiment and potential trend reversals across multiple assets.
A trading indicator that identifies liquidity zones on charts by analyzing pivot points and volume strength, highlighting potential areas of significant market activity and price reactions.
The Gann Box is a technical analysis tool that uses geometric principles to identify potential support and resistance levels, forecast price movements, and analyze market trends.
A psychological support/resistance indicator that identifies potential price reaction zones based on sequential candle movements and provides hypothetical support and resistance levels.
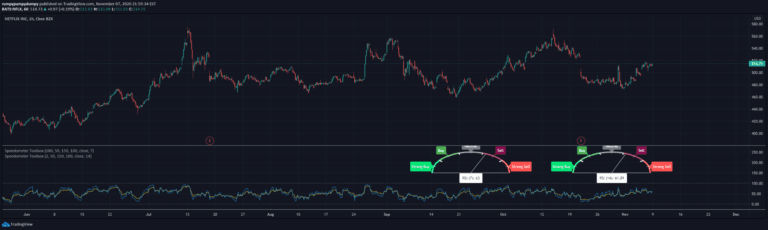
Custom metric speedometers provide specialized visualization techniques for tracking and representing performance indicators through graphical gauge-like representations.
A drawing tool for identifying XABCD harmonic patterns on trading charts, allowing manual selection of pivot points to detect potential trend reversal or continuation zones.
An advanced Fibonacci-based trading indicator that automatically plots pivot point boxes, offering customizable retracement levels, time zones, and visual alerts for market analysis.
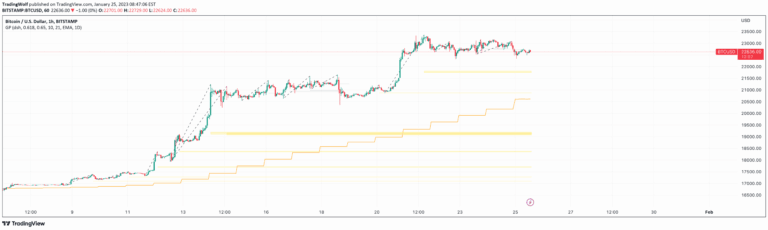
Golden Pocket is a Fibonacci retracement tool that identifies key price levels between 0.618 and 0.65, helping traders find potential entry points during market retracements.
Likes, views, and comments are historical TradingView snapshots. They describe attention, not trading performance.