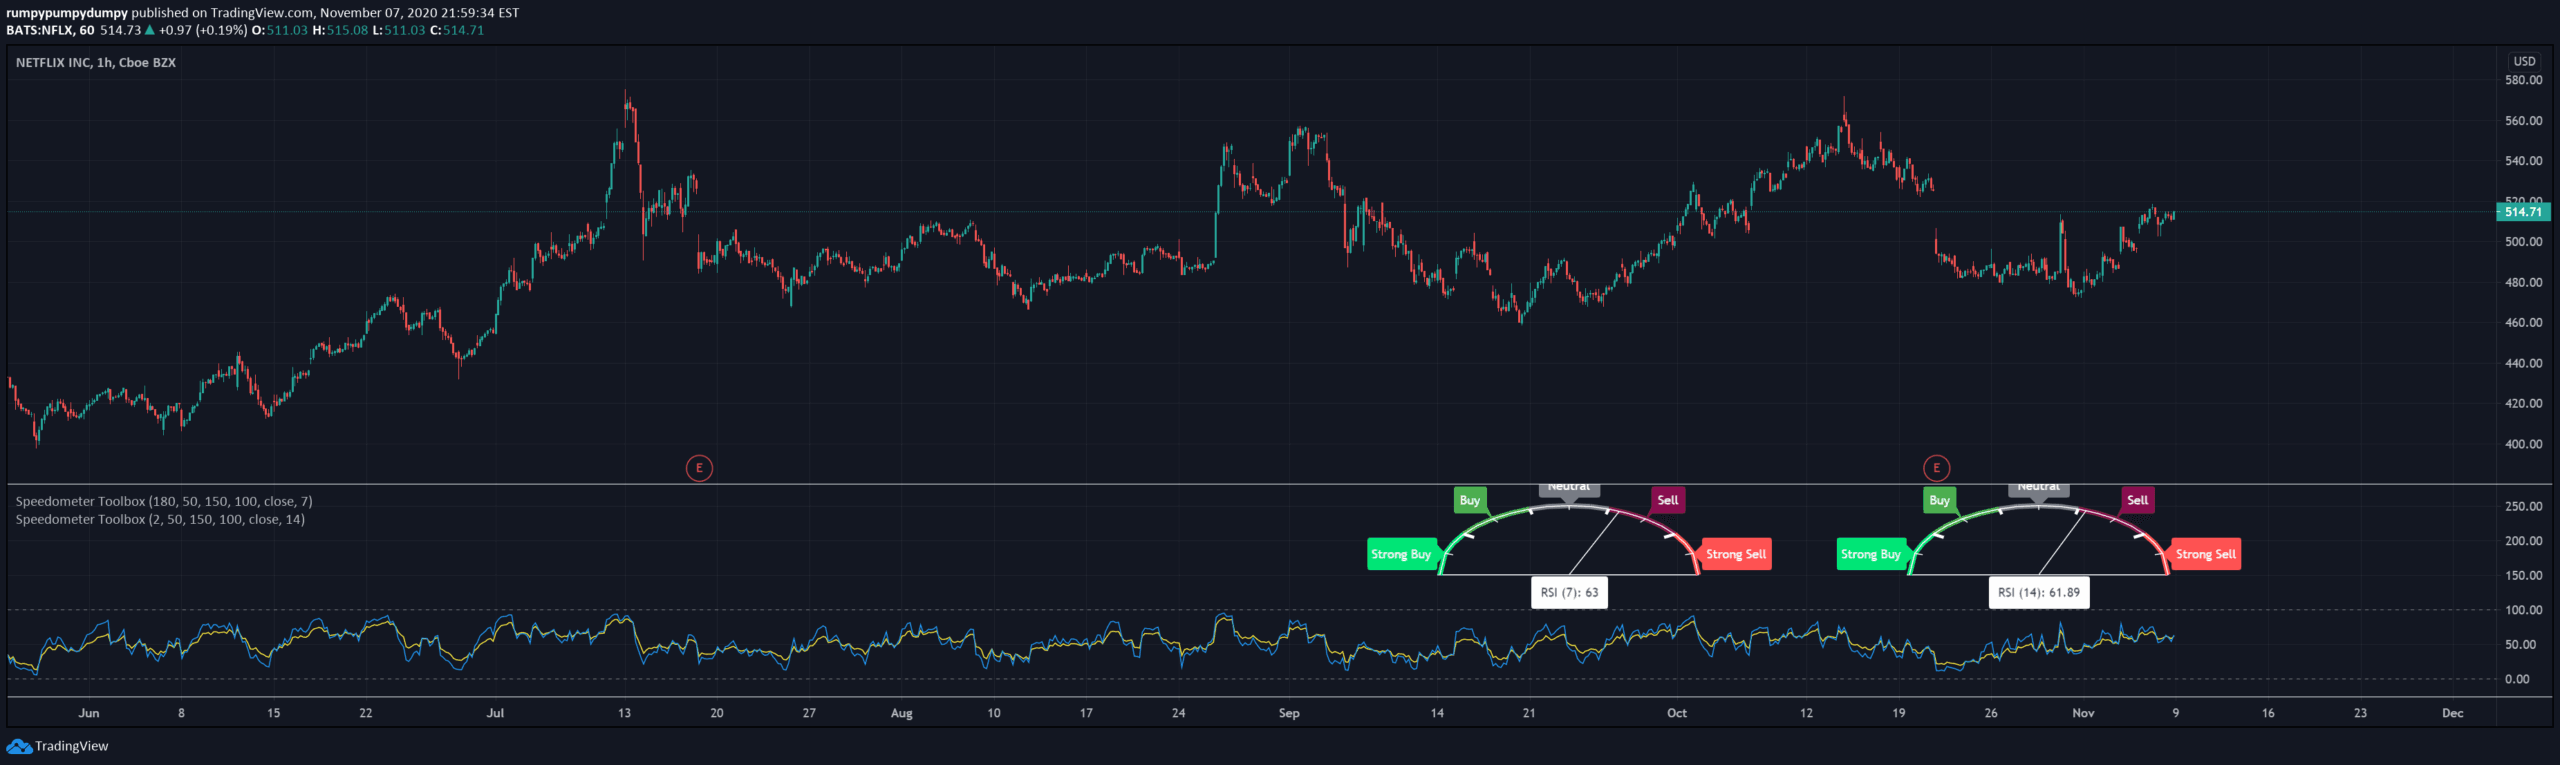
Custom metric speedometers provide specialized visualization techniques for tracking and representing performance indicators through graphical gauge-like representations.
Explore complementary indicator rolesHow it works
Custom metric speedometers function by translating numerical data into visual gauge representations similar to vehicle dashboard displays. They convert complex numerical information into intuitive graphical formats. The speedometer design allows immediate comprehension of performance metrics through color-coded and graduated visual scales.
Each speedometer can be configured with unique thresholds and color ranges to highlight different performance zones. The graphical representation enables quick visual assessment of current status relative to predefined benchmarks. These custom gauges can be dynamically updated in real-time. The design allows for flexible customization based on specific analytical requirements
Why it may be useful
Custom metric speedometers enhance data visualization by transforming abstract numerical data into immediately comprehensible visual formats. They reduce cognitive load by presenting complex information through intuitive graphical interfaces. These visualization tools enable faster decision-making by allowing rapid performance assessment.
Speedometers provide instant insights into key performance indicators without requiring detailed numerical analysis. They support quick pattern recognition and trend identification. The visual representation helps stakeholders quickly understand current status and potential trajectory. Custom speedometers can be tailored to specific business or trading contexts
When to explore it
Custom metric speedometers are most effective when dealing with complex numerical data that requires rapid comprehension. They work best in scenarios requiring quick performance assessments across multiple metrics simultaneously. These visualization tools are particularly useful in dynamic environments with rapidly changing data points.
They excel in contexts where immediate visual understanding is crucial for decision-making. Speedometers are ideal for presenting key performance indicators in dashboards and reporting systems. They are especially valuable when communicating performance metrics to non-technical audiences. Custom speedometers can be applied across various domains including finance, trading, and business analytics
Keep exploring
What we’ve verified
Access, alerts and repainting behaviour have not been independently verified for this indicator. Check the creator’s current publication and settings.
General descriptions and classifications are recovered research. Verified details above identify the specific checks we have completed. Check the creator’s current publication for later changes.