
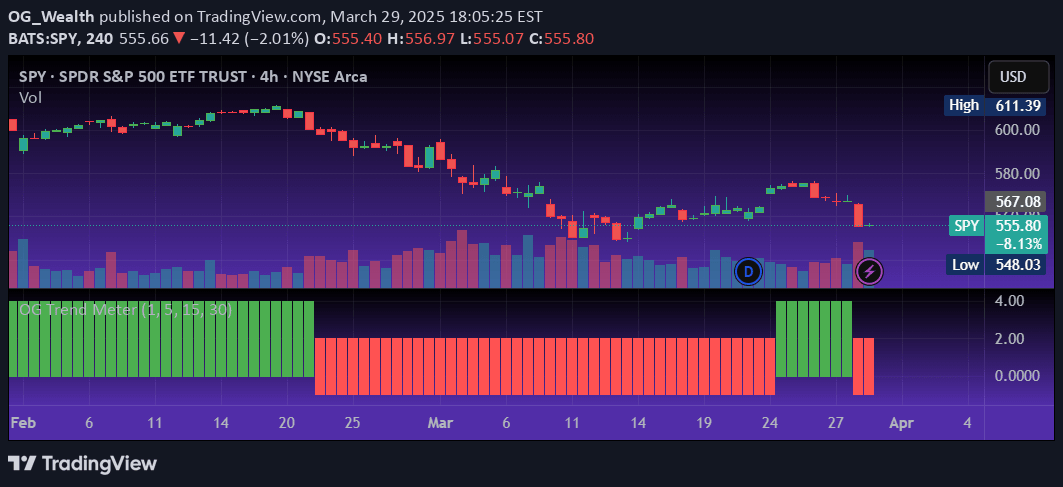
A multi-timeframe trend analysis tool that visually confirms market direction across 1m, 5m, 15m, and 30m charts using EMA alignment, price action, and momentum indicators.
Explore complementary indicator rolesHow it works
The OG Trend Meter systematically analyzes trend dynamics across four key intraday timeframes: 1-minute, 5-minute, 15-minute, and 30-minute charts. It evaluates each timeframe through a comprehensive lens of exponential moving average (EMA) alignment, assessing how different moving averages are positioned relative to each other and price action.
By incorporating momentum indicators and price behavior, the tool generates clear visual signals using green and red color codes to represent bullish and bearish trend states. This methodology allows traders to quickly understand the prevailing market sentiment and trend strength across multiple timeframe perspectives.
Why it may be useful
The OG Trend Meter provides traders with a rapid, intuitive method of understanding market directional bias across different timeframes. By condensing complex trend analysis into a simple, color-coded interface, it helps traders make faster, more informed trading decisions with enhanced clarity and reduced cognitive load.
More importantly, this tool mitigates the risk of trading against the dominant trend by offering a holistic view of market momentum. Traders can avoid potential fakeouts and align their strategies with the most probable directional movement, thereby improving overall trade probability and risk management.
When to explore it
The OG Trend Meter is most effective for traders seeking multi-timeframe confirmation before executing trades, particularly in volatile or uncertain market conditions. It is especially valuable for intraday traders who need to quickly assess trend dynamics across short-term timeframes, from scalping to day trading scenarios.
Traders should utilize this tool in conjunction with complementary indicators like the OG Supertrend or EMA Stack to create high-probability trade setups. It is particularly useful when seeking to validate trend strength, reduce false signals, and maintain trading discipline by staying aligned with the dominant market direction.
Keep exploring
What we’ve verified
Access, alerts and repainting behaviour have not been independently verified for this indicator. Check the creator’s current publication and settings.
General descriptions and classifications are recovered research. Verified details above identify the specific checks we have completed. Check the creator’s current publication for later changes.


