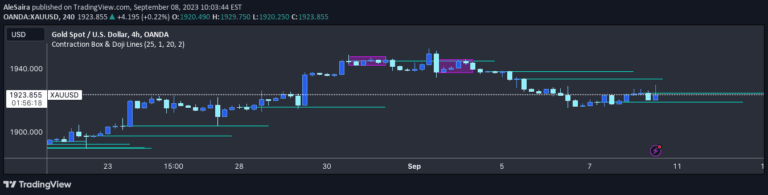
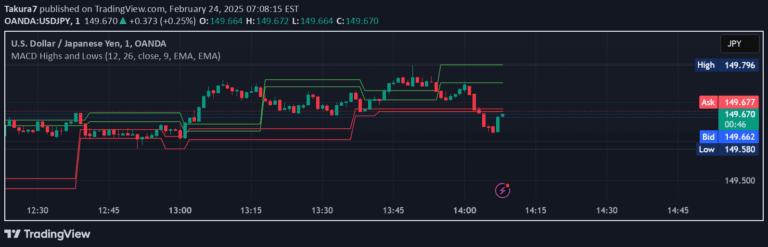
A psychological support/resistance indicator that identifies potential price reaction zones based on sequential candle movements and provides hypothetical support and resistance levels.
Explore complementary indicator rolesHow it works
The Psychological Support/Resistance indicator analyzes sequential candles moving in the same direction to create potential support and resistance levels. By tracking the number of consecutive candles, the script identifies zones where price is likely to react significantly, offering traders visual representations of potential price boundaries.
Users can customize the indicator by selecting the level's width calculation method: using Average (AVG), Close, or Open price. This flexibility allows traders to adjust the indicator's sensitivity and precision according to their trading strategy and market conditions.
Why it may be useful
Understanding psychological support and resistance levels is crucial for traders seeking to anticipate potential price movements and make informed trading decisions. These levels represent zones where market participants are likely to exhibit specific behavioral patterns, potentially triggering significant price reactions or trend continuations.
By providing visual representations of these critical price zones, the indicator helps traders identify potential entry and exit points, manage risk, and develop more strategic trading approaches across different market conditions and timeframes.
When to explore it
The Psychological Support/Resistance indicator is most effective in markets with clear trending or ranging characteristics, where price tends to respect established support and resistance levels. It performs exceptionally well in volatile markets where traders are looking for precise entry and exit points based on potential price reaction zones.
Traders should use this indicator in conjunction with other technical analysis tools to confirm signals and validate potential trade setups. It is particularly useful for identifying potential breakout opportunities, assessing trend strength, and understanding market psychology at critical price levels.
Keep exploring
What we’ve verified
Access, alerts and repainting behaviour have not been independently verified for this indicator. Check the creator’s current publication and settings.
General descriptions and classifications are recovered research. Verified details above identify the specific checks we have completed. Check the creator’s current publication for later changes.