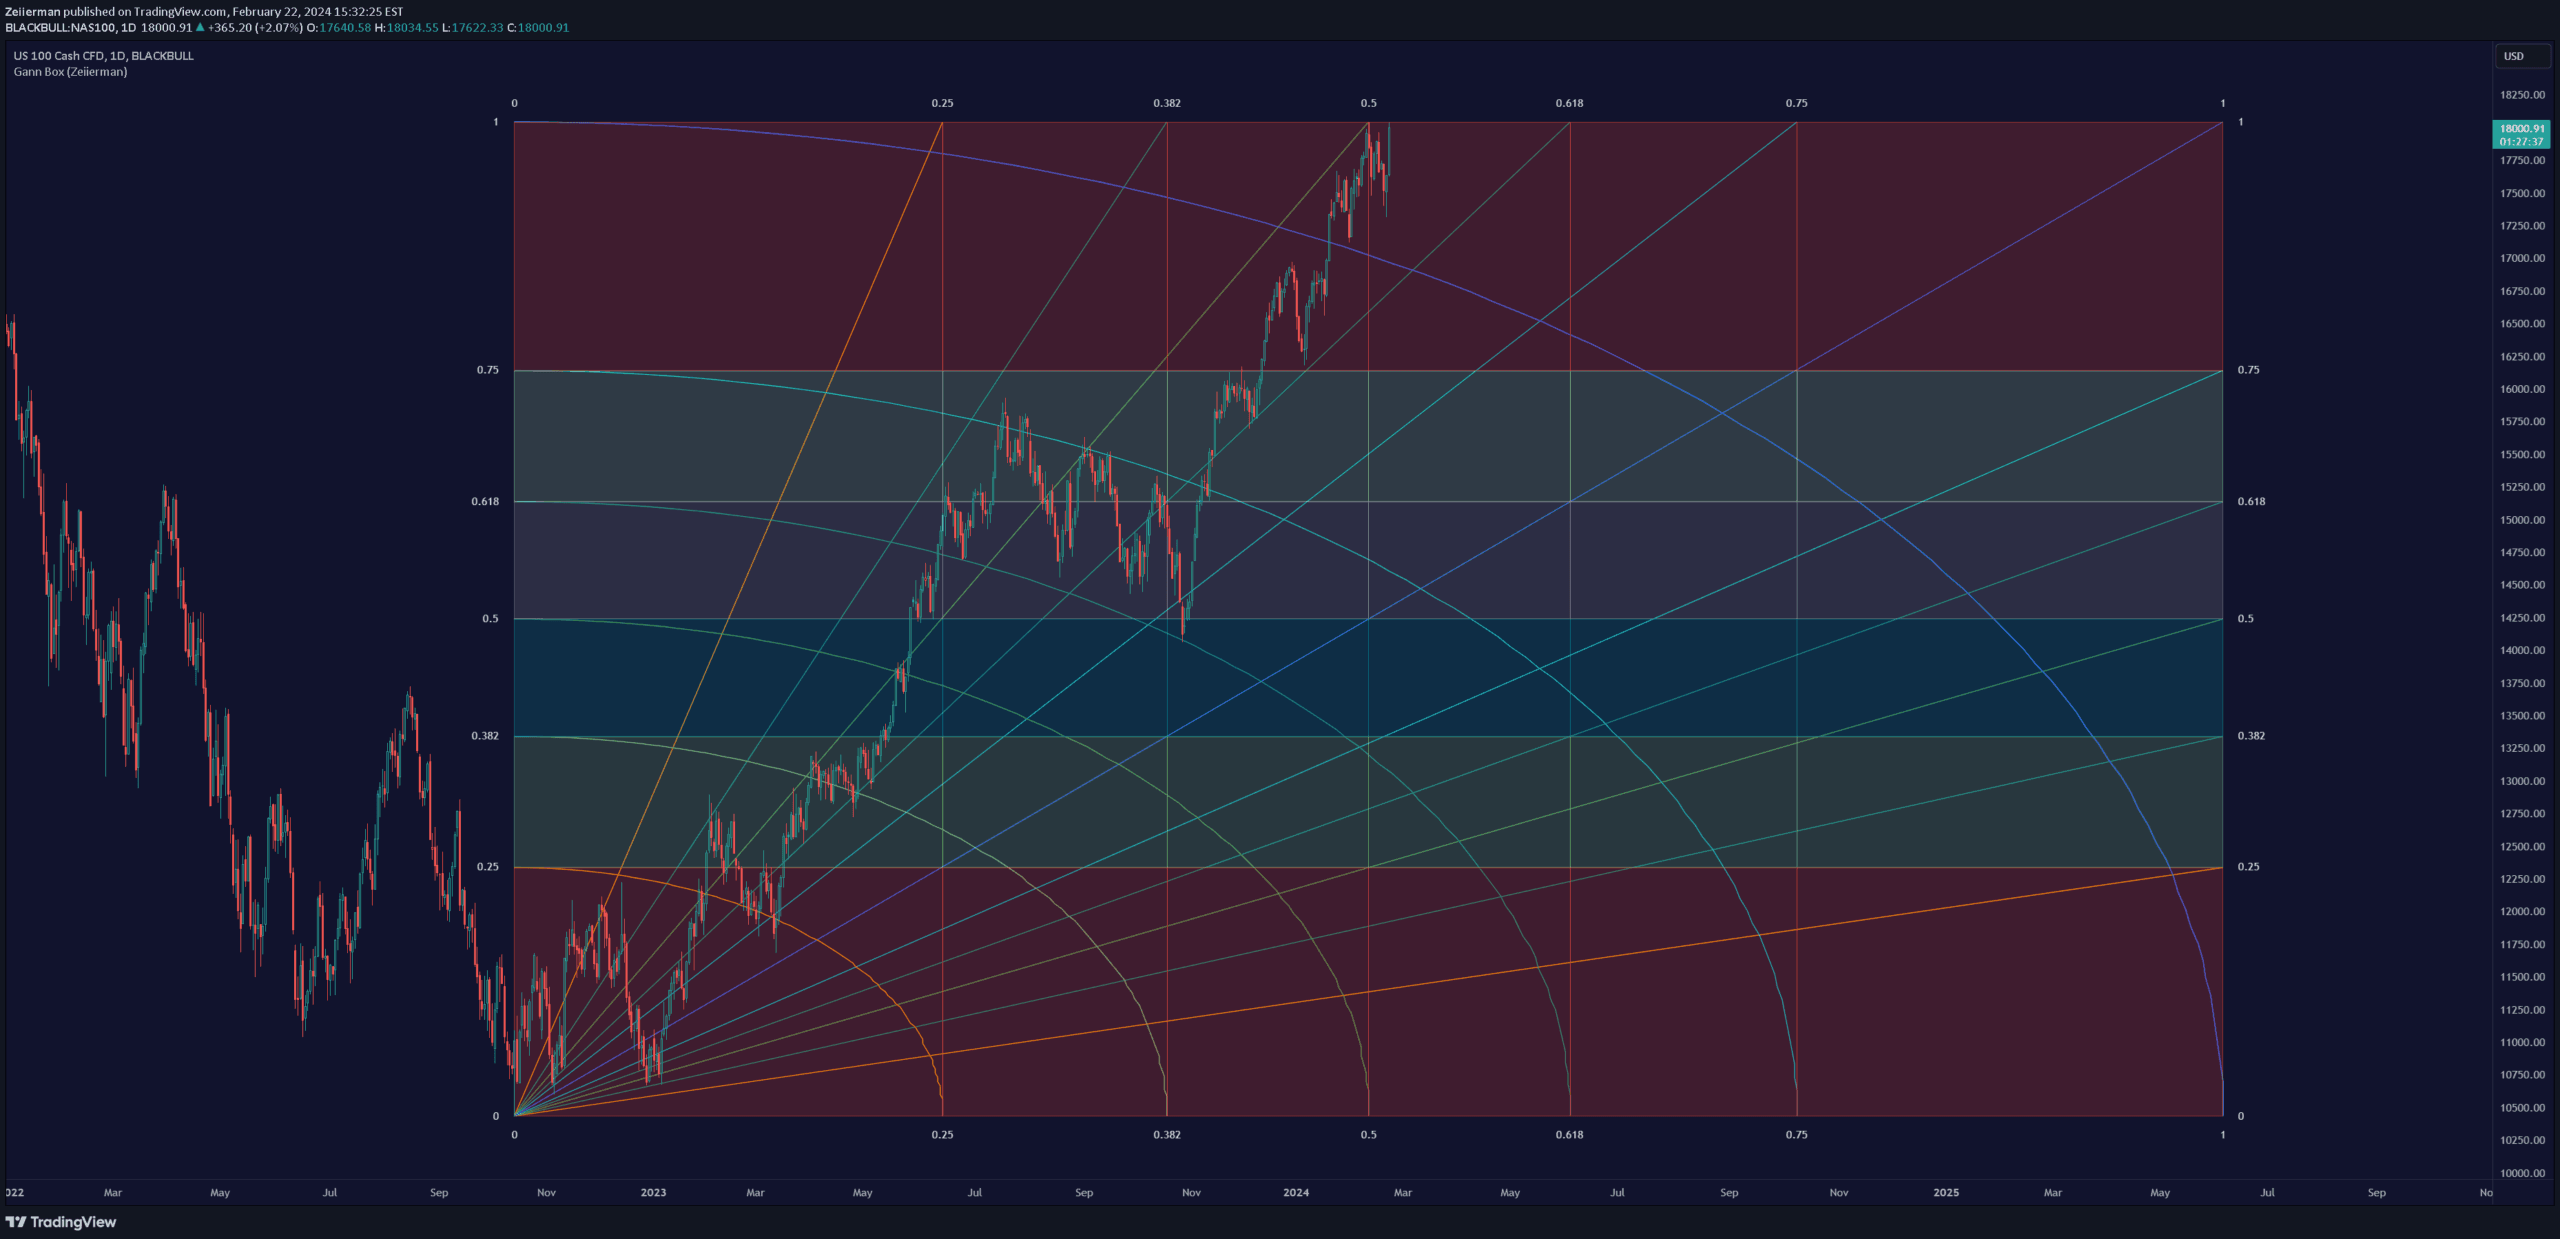
The Gann Box is a technical analysis tool that uses geometric principles to identify potential support and resistance levels, forecast price movements, and analyze market trends.
Explore complementary indicator rolesHow it works
The Gann Box operates by identifying the highest and lowest price points on a chart and constructing a geometric box divided into specific percentage levels. It uses Gann's principles of geometry and market analysis to draw angles, fans, and curves that represent potential support and resistance areas.
The indicator calculates key levels within the box, creating a grid-like framework for price movement analysis. By dividing time and price proportionally, it helps traders visualize potential market turning points and future price trajectories. The box can be extended beyond current price action for predictive analysis
Why it may be useful
The Gann Box provides traders with a unique geometric approach to market analysis, offering insights beyond traditional technical indicators. By mapping price movements using mathematical and geometric principles, it helps traders identify potential trend reversals and key support/resistance levels.
The indicator's ability to forecast future price movements gives traders a strategic advantage in understanding market dynamics. Its multi-dimensional approach combines price, time, and geometric angles to provide a comprehensive market analysis tool. Traders can customize the box's settings to suit different market conditions and trading strategies
When to explore it
The Gann Box is most effective in markets with clear trending characteristics and recognizable geometric price patterns. It works best in markets with moderate volatility where price movements show discernible trends and repeatable geometric behaviors.
Traders should use this indicator when seeking to identify potential support and resistance levels, forecast future price movements, and understand underlying market geometry. It is particularly useful for swing traders and day traders looking to anticipate market turning points. The indicator is most reliable when combined with other technical analysis tools to confirm signals
Keep exploring
What we’ve verified
Access, alerts and repainting behaviour have not been independently verified for this indicator. Check the creator’s current publication and settings.
General descriptions and classifications are recovered research. Verified details above identify the specific checks we have completed. Check the creator’s current publication for later changes.