Auto Fibonacci and Gann Fan/Retracements Combo
A comprehensive technical analysis tool combining Fibonacci and Gann fan/retracements to identify potential support, resistance, and price movement levels across multiple chart perspectives.
Explore 11,183 indicators. Filter beyond the obvious.
Discover the tools that fit the way you trade.
11,183 tools to explore
A comprehensive technical analysis tool combining Fibonacci and Gann fan/retracements to identify potential support, resistance, and price movement levels across multiple chart perspectives.
The Gann Box is a technical analysis tool that uses geometric principles to identify potential support and resistance levels, forecast price movements, and analyze market trends.
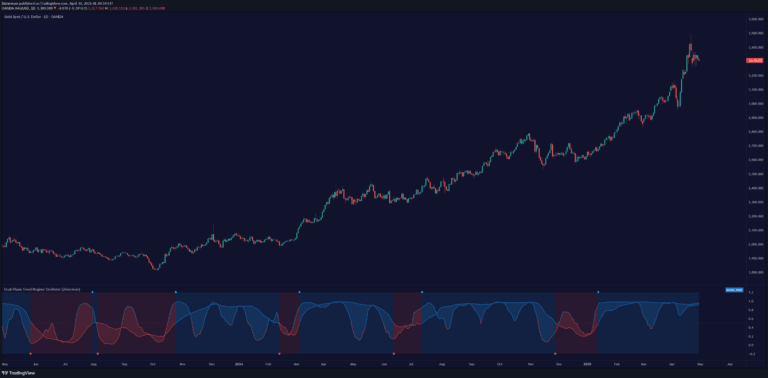
The Relative Trend Index (RTI) is an advanced technical indicator that measures trend strength by analyzing price positioning within its recent range, offering more adaptive insights than traditional momentum tools.
A technical analysis tool based on W.D. Gann's Square of 144, helping traders identify potential price targets, support, and resistance levels through geometric price and time calculations.
A multi-dimensional scalping indicator that combines trend, momentum, volume, and volatility into a unique quantum flux candle oscillator for precise trade signal generation.
The Dynamic Price Oscillator (DPO) is a momentum indicator that measures price deviations from a moving average while integrating volatility adjustments and Bollinger Bands for advanced market analysis.
A sophisticated trading indicator using Square of Nine methodology to forecast potential support and resistance levels by analyzing market pivots and price progression across geometric angles.
The Gann Square of 9 is a technical analysis tool that helps traders identify potential support and resistance levels by mapping price movements on a geometric grid.
A dynamic trend classification tool that adapts to market volatility by switching between slow and fast oscillators, providing insights into market trends and regime changes.
SAR MACD is a hybrid trading indicator combining MACD and Parabolic SAR to detect trend direction, eliminate fake signals, and confirm market movements with color-coded visual indicators.
A planetary aspect oscillator that tracks the angular relationships between planets, offering unique insights into potential market influences through astrological energy measurements.
A dynamic trading indicator using Gann Square of 9 methodology to identify trend direction, reversal levels, and potential price movements across multiple market conditions.
Likes, views, and comments are historical TradingView snapshots. They describe attention, not trading performance.