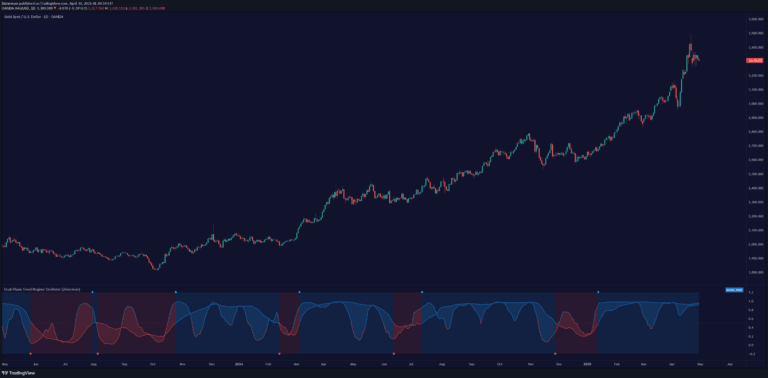
The Dynamic Price Oscillator (DPO) is a momentum indicator that measures price deviations from a moving average while integrating volatility adjustments and Bollinger Bands for advanced market analysis.
Explore complementary indicator rolesHow it works
The Dynamic Price Oscillator calculates the difference between the current closing price and a moving average, adjusting for volatility using the True Range method. It smooths this difference over a user-defined period to create an oscillator.
Bollinger Bands are then applied directly to the oscillator, providing visual representations of market volatility. The indicator tracks price momentum by measuring how far current prices deviate from their average trend. By incorporating volatility measurements, it offers a more nuanced view of price movements than traditional oscillators
Why it may be useful
Traders benefit from the DPO's comprehensive approach to market analysis by gaining insights into momentum, trend strength, and potential reversal points. The indicator helps identify overbought and oversold conditions more dynamically than standard oscillators.
Its volatility-adjusted design allows traders to understand market conditions with greater precision. The integration of Bollinger Bands provides additional context about market volatility and potential breakout scenarios. By offering multiple layers of analysis, the DPO helps traders make more informed decisions about market entry and exit points
When to explore it
The Dynamic Price Oscillator works best during trending and range-bound markets with moderate to high volatility. It is particularly effective for identifying momentum shifts, potential trend reversals, and volatility breakouts. Traders should apply the DPO when seeking confirmation of existing trends or looking for mean reversion opportunities.
The indicator is most reliable when used in conjunction with other technical analysis tools. Its effectiveness increases when applied to liquid markets with consistent price movements. Traders should adjust the indicator's length and smoothing parameters to match their specific trading style and market conditions
Keep exploring
What we’ve verified
Access, alerts and repainting behaviour have not been independently verified for this indicator. Check the creator’s current publication and settings.
General descriptions and classifications are recovered research. Verified details above identify the specific checks we have completed. Check the creator’s current publication for later changes.