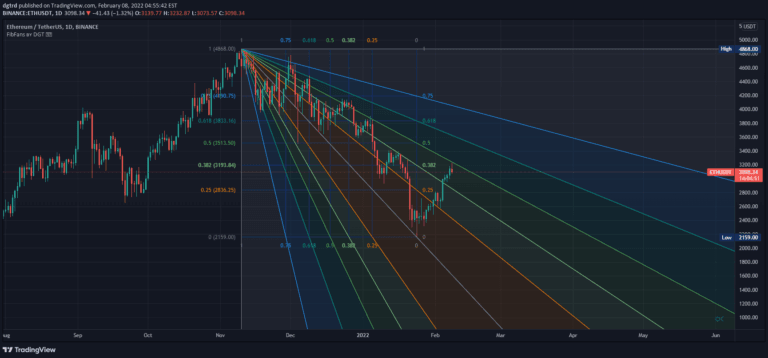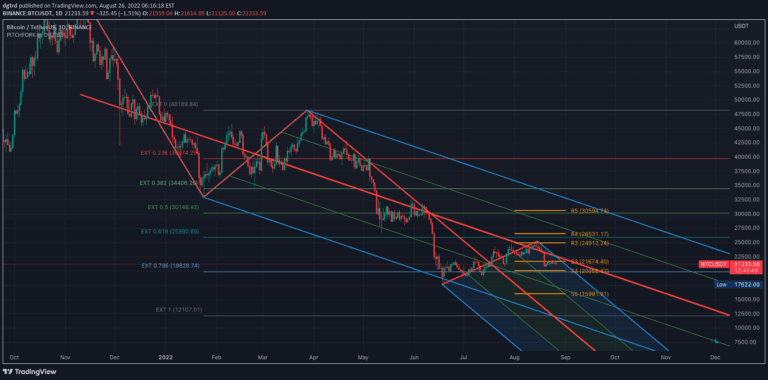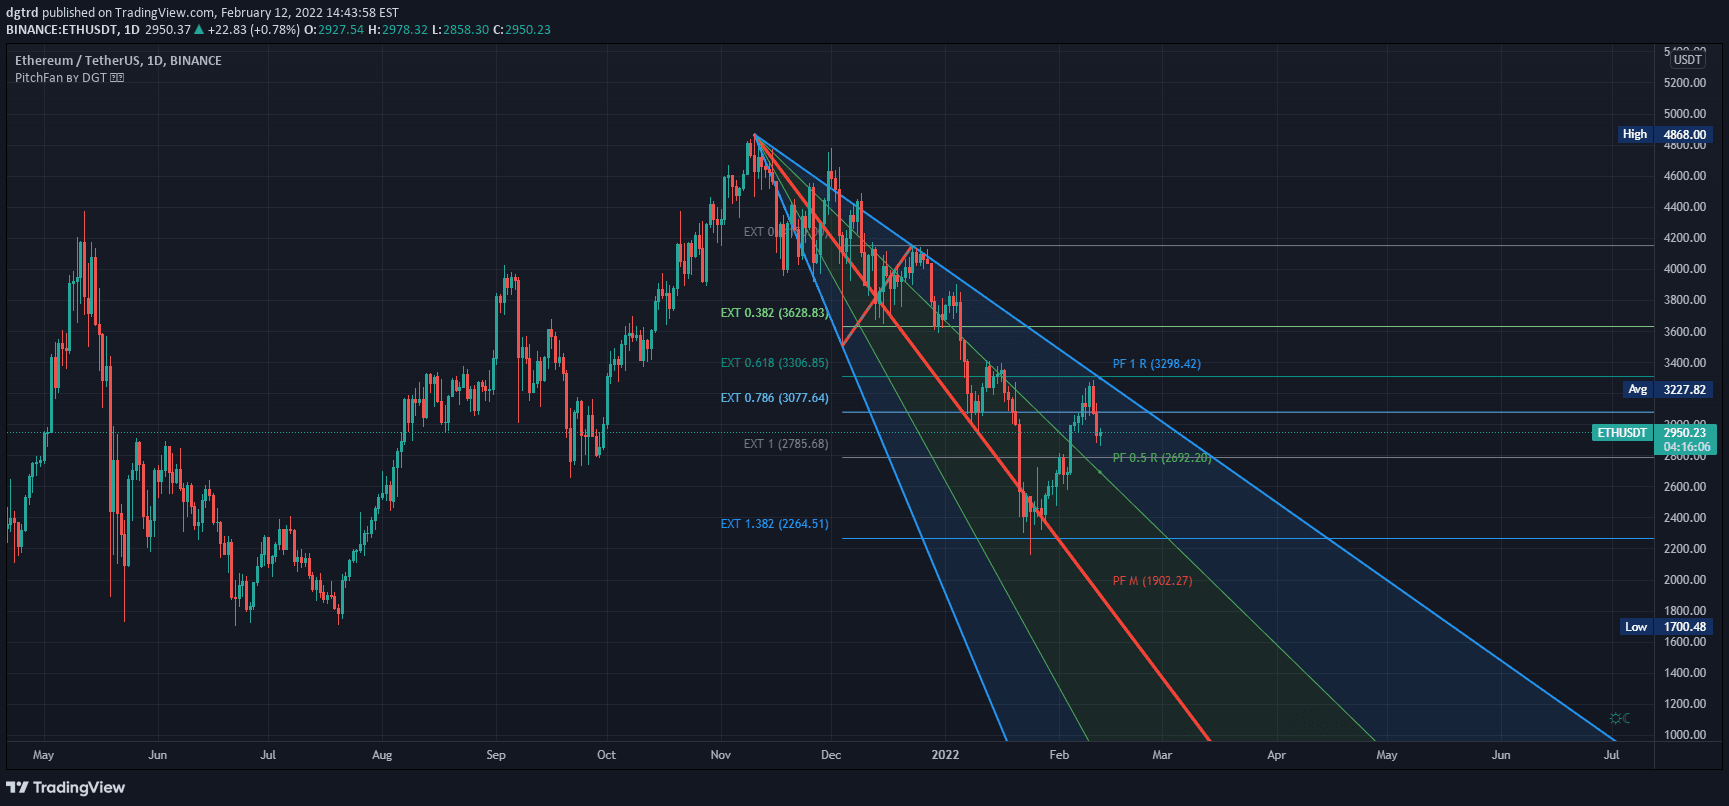
An advanced trading tool combining PitchFan, Fibonacci Extensions/Retracements, and ZigZag to identify potential support, resistance levels, and trend continuation signals.
Explore complementary indicator rolesHow it works
The indicator automatically plots PitchFan rays based on pivot points, creating diagonal support and resistance lines. It uses Fibonacci coefficients to generate extension and retracement levels, helping traders identify potential price turning points.
The ZigZag component filters price movements by a specified deviation, connecting significant pivot points. PitchFan rays are drawn from the start of a trend, with each ray representing a potential support or resistance level. Fibonacci levels are calculated by taking two extreme points and dividing the vertical distance by key Fibonacci coefficients
Why it may be useful
This multi-component indicator provides traders with a comprehensive view of potential price movements and trend dynamics. By combining PitchFan, Fibonacci tools, and ZigZag, traders can identify more precise entry and exit points.
The tool helps visualize trend strength, potential reversal zones, and support/resistance levels. It offers a systematic approach to analyzing price action, reducing emotional decision-making. Traders can use these insights to develop more strategic trading plans and improve risk management
When to explore it
The indicator works best in trending markets with clear directional movements. It is most effective when price has completed an initial trend wave and entered a correction phase. Traders should apply this tool on timeframes that show clear swing highs and lows.
It is particularly useful for identifying potential trend continuation after pullbacks. The indicator is most reliable when combined with other technical analysis tools and fundamental market understanding
Keep exploring
What we’ve verified
Access, alerts and repainting behaviour have not been independently verified for this indicator. Check the creator’s current publication and settings.
General descriptions and classifications are recovered research. Verified details above identify the specific checks we have completed. Check the creator’s current publication for later changes.