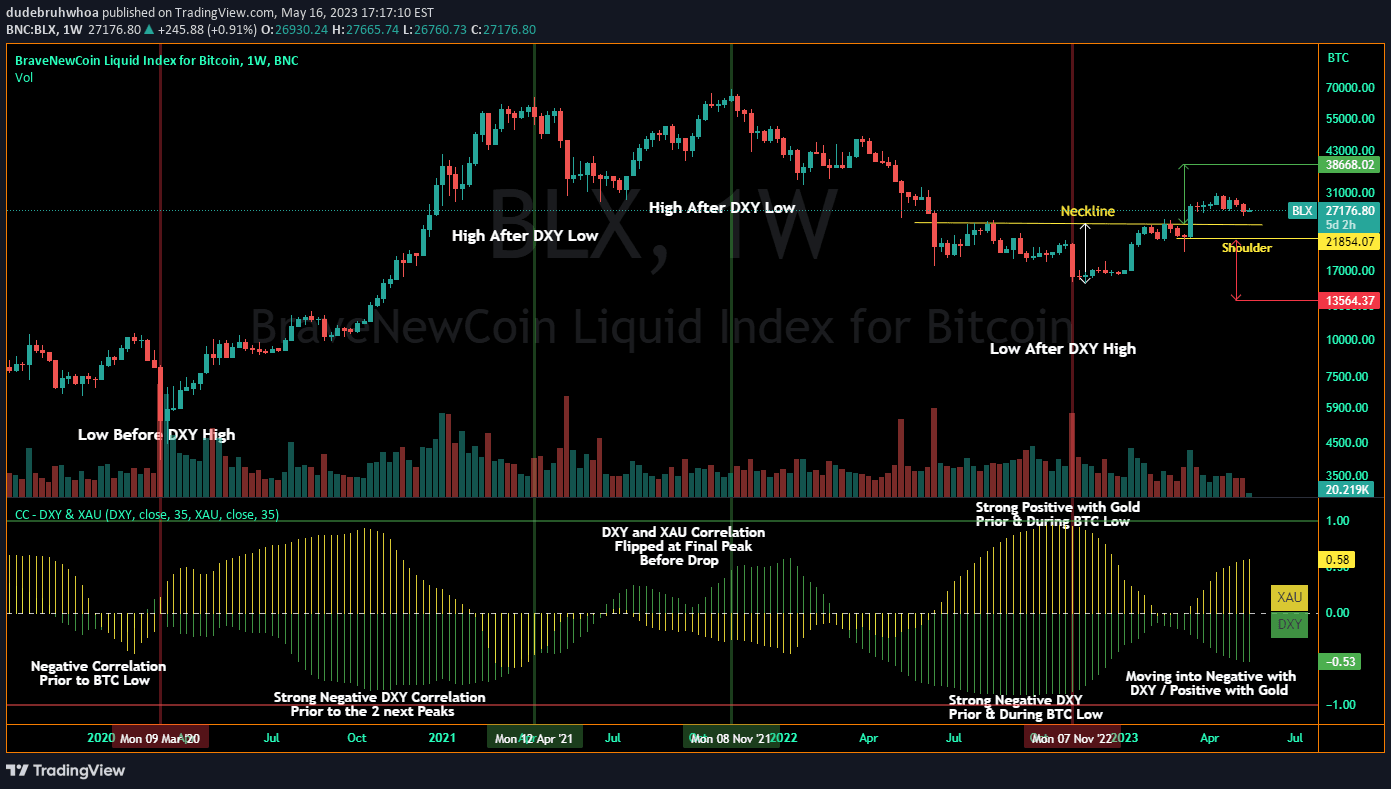
A multi-timeframe correlation indicator that measures relationship between two financial assets across different time periods, revealing how assets move relative to each other.
Explore complementary indicator rolesHow it works
The indicator calculates correlation coefficients between two financial assets across three different timeframes, typically 20, 50, and 200 bars. It computes the statistical relationship between price movements, generating a coefficient ranging from -1 to +1, which represents how closely the assets move together.
By comparing the current symbol with a reference symbol, the script generates color-coded outputs representing short-term (green), medium-term (yellow), and long-term (red) correlations. Horizontal reference lines at +1, 0, and -1 help traders quickly interpret the correlation strength and direction.
Why it may be useful
Correlation analysis provides critical insights into asset relationships, helping traders understand market dynamics and potential investment strategies. By revealing how different assets move in relation to each other, traders can make more informed decisions about portfolio diversification, risk management, and potential trading opportunities.
Understanding correlation allows traders to identify assets that move together or inversely, which can be crucial for constructing balanced portfolios and managing overall investment risk. The multi-timeframe approach provides a comprehensive view of asset relationships across different market conditions and time horizons.
When to explore it
This indicator is most effective when analyzing potential relationships between different financial instruments, particularly during periods of market uncertainty or when exploring diversification strategies. Traders can use it to identify assets with complementary price movements or to find potential hedging opportunities.
The correlation indicator is particularly valuable when examining assets across different sectors, asset classes, or geographic regions. It can help traders confirm broader market trends, identify potential divergence opportunities, and develop more sophisticated trading and investment approaches.
Keep exploring
What we’ve verified
Access, alerts and repainting behaviour have not been independently verified for this indicator. Check the creator’s current publication and settings.
General descriptions and classifications are recovered research. Verified details above identify the specific checks we have completed. Check the creator’s current publication for later changes.