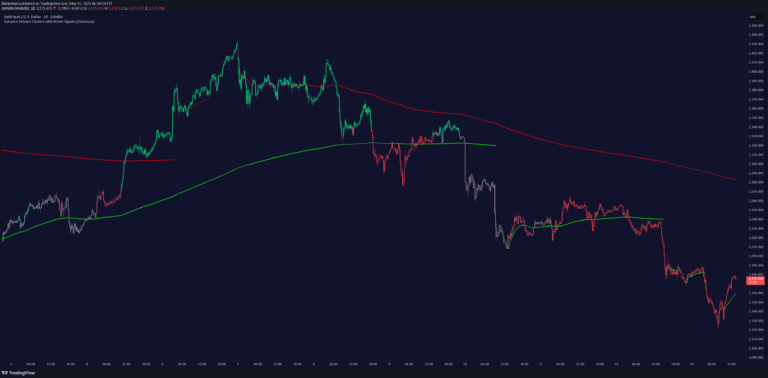
A specialized indicator that identifies liquidity grab zones in price action, highlighting potential market reversal or acceleration areas through custom pivot and wick analysis.
Explore complementary indicator rolesHow it works
The Liquidity Grab Zones Indicator identifies potential market interest areas by analyzing pivot points and candle formations. It first examines recent price pivots, looking for false breakouts where a candle's wick-to-body ratio exceeds a predetermined threshold.
When these specific conditions are met, the indicator plots buyside and sellside liquidity grab zones on the chart. These zones represent areas where significant market orders might have been executed, potentially indicating future price movement or reversal points.
Why it may be useful
Liquidity grab zones provide traders with critical insights into market dynamics and potential price action movements. By identifying areas of high market interest, traders can make more informed decisions about potential entry and exit points for their trades.
The indicator's ability to highlight zones where significant market orders have been executed helps traders understand underlying market sentiment and potential future price movements, offering a strategic advantage in interpreting complex market structures.
When to explore it
The Liquidity Grab Zones Indicator is most effective in markets with clear price action and identifiable pivot points. It works best in trading environments where rapid price movements and market order executions are common, such as forex, cryptocurrency, and active stock markets.
Traders should use this indicator in conjunction with other technical analysis tools to confirm signals and validate potential trading opportunities. It is particularly useful for short-term trading strategies that rely on quick identification of market sentiment and potential reversal points.
Keep exploring
What we’ve verified
Access, alerts and repainting behaviour have not been independently verified for this indicator. Check the creator’s current publication and settings.
General descriptions and classifications are recovered research. Verified details above identify the specific checks we have completed. Check the creator’s current publication for later changes.