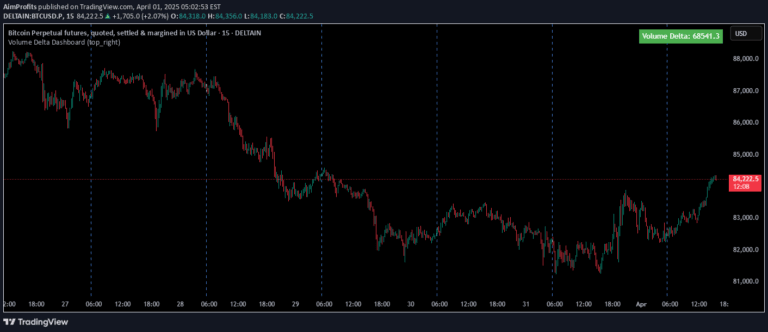
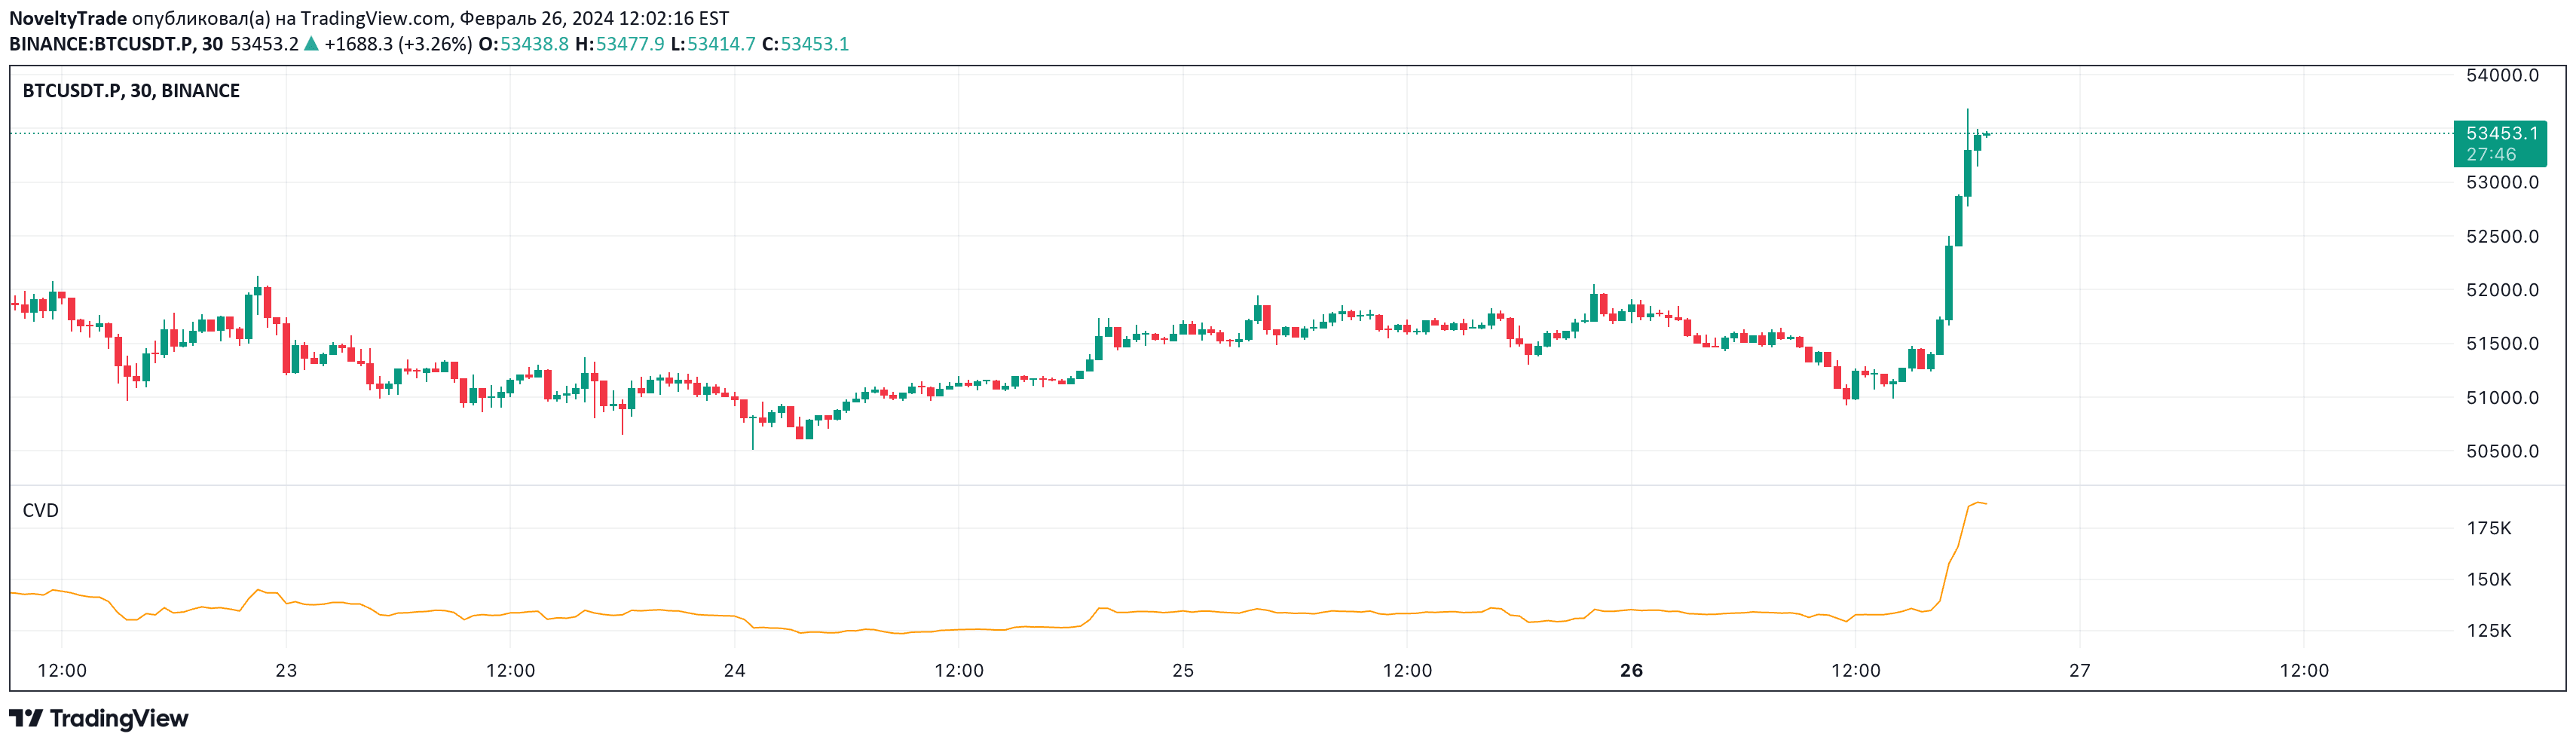
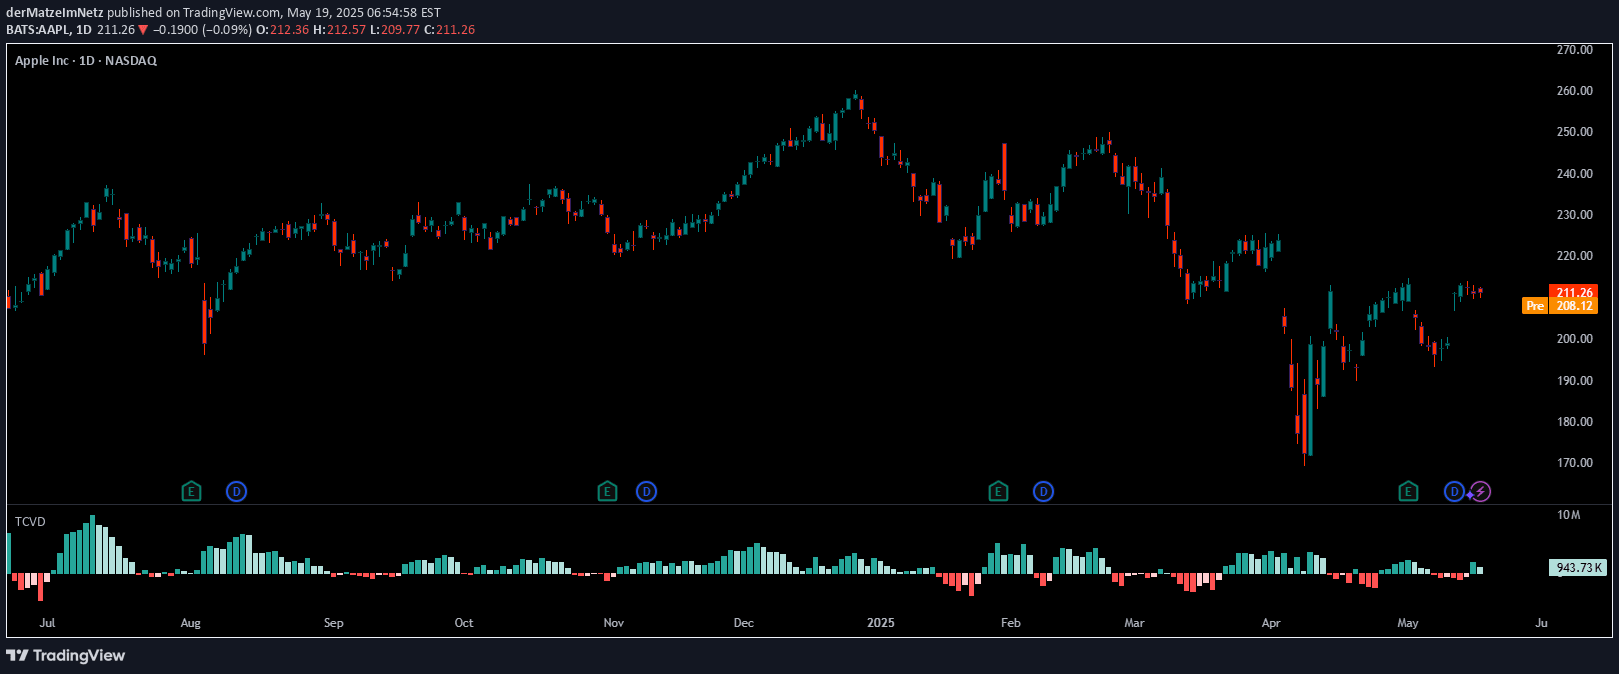
A volume analysis tool comparing tick and lower time frame data to measure price and volume movements, revealing volume delta and cumulative volume delta in trading.
Explore complementary indicator rolesHow it works
The Volume Delta Compare indicator analyzes volume data through two methods: tick-based and lower time frame (LTF) data. It tracks volume during price movements, categorizing volume as upward, downward, or neutral.
The indicator calculates volume delta by subtracting downward volume from upward volume and creates a cumulative volume delta. It uses different data collection techniques to provide insights into volume changes, comparing real-time tick data with lower time frame aggregated data
Why it may be useful
Understanding volume dynamics is crucial for traders seeking to confirm price movements and detect potential trend reversals. This indicator provides granular insights into volume behavior, revealing how volume changes correspond with price action.
By comparing different data collection methods, traders can identify discrepancies and gain a more comprehensive view of market sentiment. The volume delta helps traders understand buying and selling pressure, potentially signaling trend strength or weakness
When to explore it
This indicator is most effective during periods of significant price movement and market volatility. Traders can use it to confirm trend reversals, detect potential divergences between price and volume, and assess market sentiment.
It works best in liquid markets with consistent trading volume. Scalpers and day traders can benefit from its detailed volume analysis, using it to make quick trading decisions. The tool is particularly useful when comparing different timeframes and understanding subtle volume dynamics
Keep exploring
What we’ve verified
Access, alerts and repainting behaviour have not been independently verified for this indicator. Check the creator’s current publication and settings.
General descriptions and classifications are recovered research. Verified details above identify the specific checks we have completed. Check the creator’s current publication for later changes.