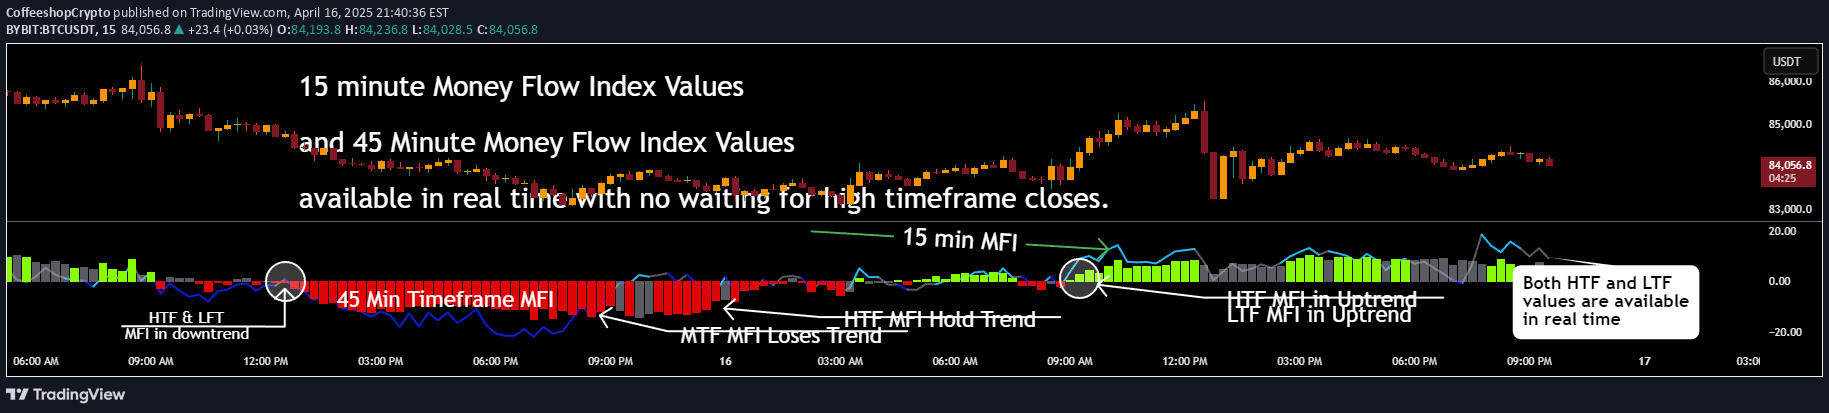
A multi-timeframe MACD indicator that provides real-time trend analysis across different timeframes without manually switching charts, enabling more comprehensive trend confirmation.
Explore complementary indicator rolesHow it works
The Zero Lag Multi-Timeframe MACD uses a custom time-adjusted formula to project higher timeframe MACD values onto lower timeframe charts in real time. It calculates MACD lines and histograms for both the lower timeframe (LTF) and higher timeframe (HTF), allowing traders to see trend direction simultaneously.
The indicator plots two MACD lines: one for the current chart's timeframe and another for a higher timeframe. By comparing these lines, traders can identify trend alignment, momentum, and potential entry or exit points across different time perspectives.
Why it may be useful
Traditional MACD indicators limit traders by showing trend information on a single timeframe, causing delays in decision-making and missed opportunities. This multi-timeframe approach solves that problem by providing instant trend confirmation across different time horizons.
By eliminating the need to manually switch between charts and wait for candle closes, traders can make more informed and timely trading decisions. The indicator helps identify trend strength, direction, and potential reversals more efficiently than standard MACD methods.
When to explore it
The multi-timeframe MACD works best when traders want to confirm trend direction and momentum across different time perspectives. It is particularly useful during trending markets where identifying alignment between lower and higher timeframe trends can provide more reliable entry and exit signals.
Traders should use this indicator when they want to reduce false signals, confirm trend continuity, and gain a more comprehensive view of market dynamics. It is especially effective for traders who struggle with timing entries and exits based on single-timeframe analysis.
Keep exploring
What we’ve verified
Access, alerts and repainting behaviour have not been independently verified for this indicator. Check the creator’s current publication and settings.
General descriptions and classifications are recovered research. Verified details above identify the specific checks we have completed. Check the creator’s current publication for later changes.