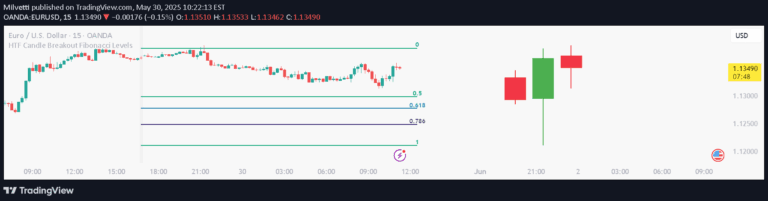
A trading indicator that identifies potential market manipulation points by tracking lower timeframe pivot highs and lows to reveal institutional trading strategies.
Explore complementary indicator rolesHow it works
The LTF Inducement Levels indicator operates by analyzing lower timeframe pivot points to detect potential market manipulation zones. It identifies and marks pivot highs in red and pivot lows in green, creating visual reference points for traders to understand potential institutional trading actions.
The indicator dynamically manages these pivot levels, removing them once they are crossed by price movement. By using configurable parameters like lower timeframe selection, pivot length, and maximum number of pivots to display, traders can customize the indicator to suit their specific trading strategy and market analysis approach.
Why it may be useful
Understanding market manipulation and institutional trading strategies can provide traders with critical insights into potential price movements and hidden market dynamics. This indicator helps traders recognize how large institutions might create price movements designed to trigger retail trader responses, offering a unique perspective on market behavior.
By revealing potential liquidity hunting zones and institutional trading tactics, the LTF Inducement Levels indicator empowers traders to make more informed decisions. It helps traders anticipate potential price manipulations and understand the underlying mechanics of market movements beyond simple price action.
When to explore it
The LTF Inducement Levels indicator is most effective in markets with strong trending characteristics and significant institutional participation. It works best when traders want to identify potential manipulation points and understand the nuanced movements within a dominant trend.
Traders should utilize this indicator during periods of clear market trends, particularly in liquid markets like forex, major stock indices, and significant commodities. It is especially useful for traders who want to gain deeper insights into market mechanics and potential institutional trading strategies.
Keep exploring
What we’ve verified
Access, alerts and repainting behaviour have not been independently verified for this indicator. Check the creator’s current publication and settings.
General descriptions and classifications are recovered research. Verified details above identify the specific checks we have completed. Check the creator’s current publication for later changes.