
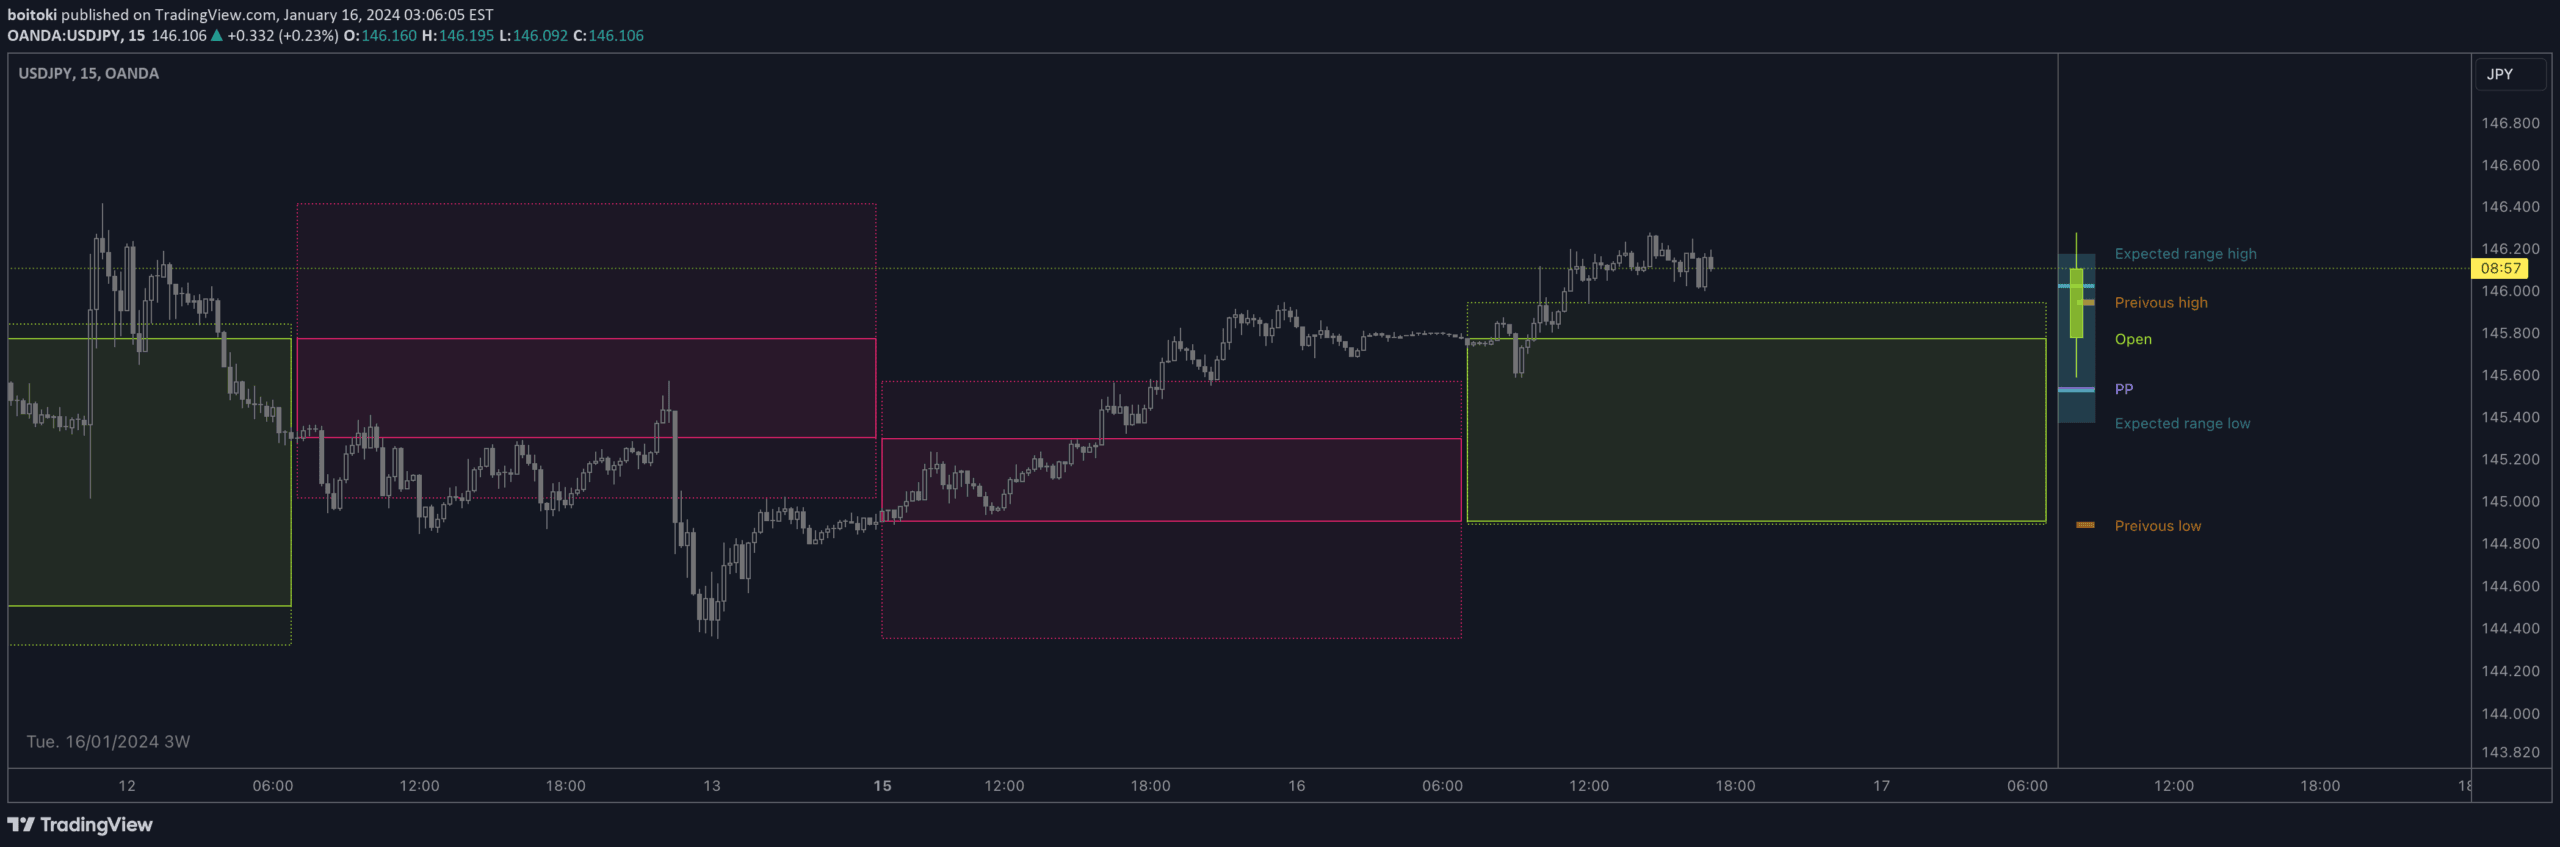
A multi-timeframe candle visualization tool that allows flexible display of historical price data with pivot point calculations and customizable viewing options.
Explore complementary indicator rolesHow it works
This indicator creates a specialized display of higher timeframe (HTF) candles within a dedicated box. Users can configure the visualization to show Open-Close, High-Low, or both candle elements. The tool offers flexible historical data views, including options to display all past candles, only today's candles, or only previous day's candles.
An additional feature allows shifting the previous candle to the current position for comparative analysis. The indicator also calculates standard pivot points and provides an optional Central Pivot Range (CPR) overlay
Why it may be useful
Traders benefit from this indicator by gaining enhanced visual insights into multi-timeframe price action. The customizable display allows for quick identification of market structure, trend dynamics, and potential support/resistance levels.
By offering multiple viewing perspectives, traders can develop a more comprehensive understanding of price movements across different time horizons. The pivot point and CPR features provide additional context for potential trading decisions and help traders identify key price levels
When to explore it
This indicator is most effective during periods of market transition or when analyzing trend continuity. It works best in markets with clear directional movements, such as forex, futures, and major stock indices.
Traders can utilize this tool during range-bound and trending market conditions to identify potential entry and exit points. The multi-timeframe visualization is particularly useful for day traders and swing traders seeking to understand broader market context beyond their primary trading timeframe
Keep exploring
What we’ve verified
Access, alerts and repainting behaviour have not been independently verified for this indicator. Check the creator’s current publication and settings.
General descriptions and classifications are recovered research. Verified details above identify the specific checks we have completed. Check the creator’s current publication for later changes.




