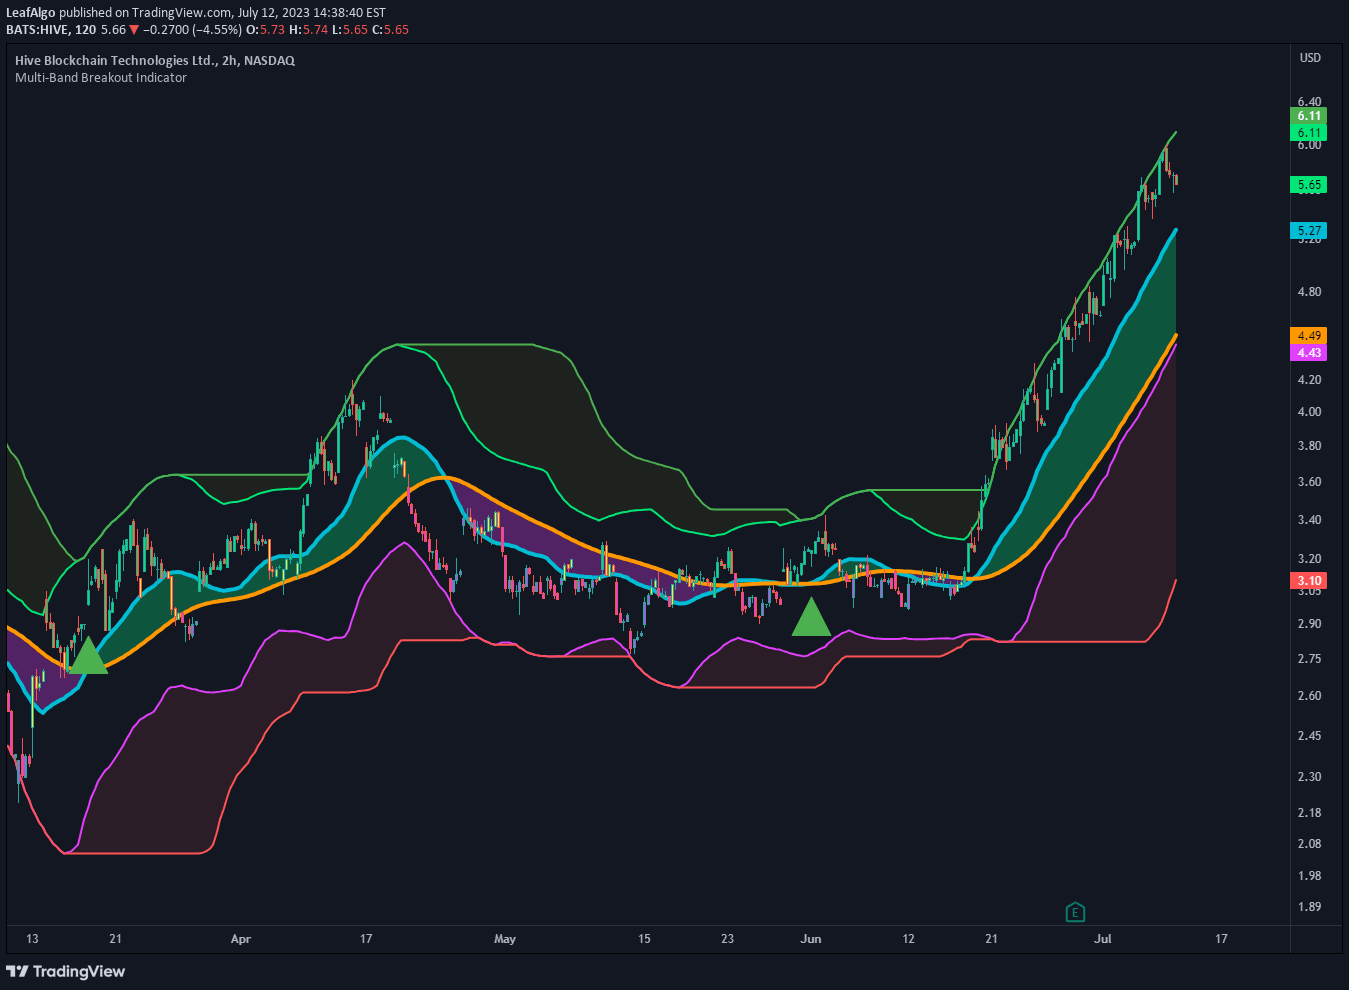
A custom trading indicator using Higher Timeframe analysis and HMA smoothing to identify potential breakout signals and market volatility zones for strategic entry points.
Explore complementary indicator rolesHow it works
The indicator operates by analyzing price movements across different timeframes, utilizing a Higher Timeframe (HTF) set to daily intervals for comprehensive market analysis. It incorporates a Hull Moving Average (HMA) smoothing line to generate signals, tracking price momentum and potential breakout conditions.
The core mechanism focuses on detecting volatility shifts, specifically when the faster volatility line rises from below zero and enters a predefined range. By combining HTF signals with HMA indicators, the system generates breakout alerts that suggest potential significant market movements, filtering out noise and false signals.
Why it may be useful
This indicator provides traders with a sophisticated method of identifying potential market trend shifts and breakout opportunities across multiple timeframes. By integrating higher timeframe analysis with volatility tracking, traders can gain deeper insights into market dynamics and potential entry points.
The combination of HMA smoothing and breakout signals offers a nuanced approach to market analysis, helping traders distinguish between random price fluctuations and meaningful trend changes. Its adaptability across different assets and timeframes makes it a valuable tool for traders seeking more refined market entry strategies.
When to explore it
The indicator is most effective during periods of potential market transition, particularly when looking for emerging trends in volatile market conditions. It performs best when applied to assets with consistent trading patterns, with the creator noting particular success when used with Bitcoin.
Traders should utilize this signal when seeking confirmation of potential significant price movements, especially during periods of market uncertainty. Its design allows for flexible application across different trading styles, making it particularly useful for traders who want a comprehensive view of market momentum and potential breakout scenarios.
Keep exploring
What we’ve verified
Access, alerts and repainting behaviour have not been independently verified for this indicator. Check the creator’s current publication and settings.
General descriptions and classifications are recovered research. Verified details above identify the specific checks we have completed. Check the creator’s current publication for later changes.