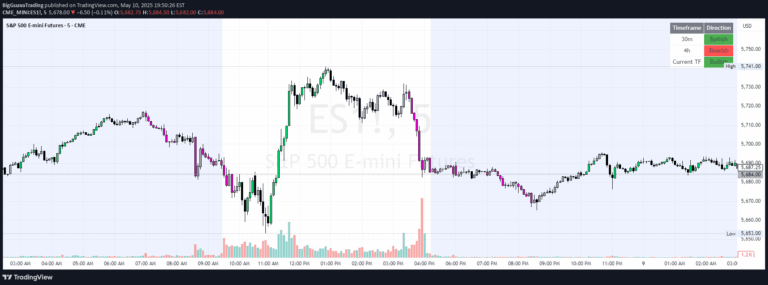
A multi-timeframe indicator that tracks price continuity across different periods, enabling traders to analyze market structure and momentum using TheStrat methodology.
Explore complementary indicator rolesHow it works
The indicator operates by allowing traders to select multiple timeframes simultaneously, including 1-hour, daily, weekly, and monthly views. It visually represents price action through color-coded candles and high/low markers, enabling comprehensive market analysis across different time intervals.
By integrating various timeframes into a single visualization, traders can quickly identify trend continuity and potential market reversals. The tool leverages TheStrat principles to provide a holistic view of price movements, making it easier to align trading decisions with broader market structures.
Why it may be useful
This indicator simplifies complex market analysis by presenting multiple timeframe information in an intuitive, visual format. It removes the guesswork from trend identification and helps traders maintain alignment with overall market momentum, regardless of their preferred trading style.
By offering flexibility and clarity, the tool empowers traders to make more informed decisions. It bridges the gap between different trading perspectives, allowing scalpers, day traders, and swing traders to understand market dynamics more comprehensively and reduce the risk of trading against the prevailing trend.
When to explore it
The indicator is most effective when traders want to confirm trend continuity across different time horizons and validate potential trade setups. It works exceptionally well during periods of market transition, helping traders identify key support and resistance levels across multiple timeframes.
Traders should utilize this tool when seeking to understand the broader market context before entering a trade. It is particularly valuable during volatile market conditions, when quick visual confirmation of trend direction and strength can provide a critical edge in decision-making.
Keep exploring
What we’ve verified
Access, alerts and repainting behaviour have not been independently verified for this indicator. Check the creator’s current publication and settings.
General descriptions and classifications are recovered research. Verified details above identify the specific checks we have completed. Check the creator’s current publication for later changes.