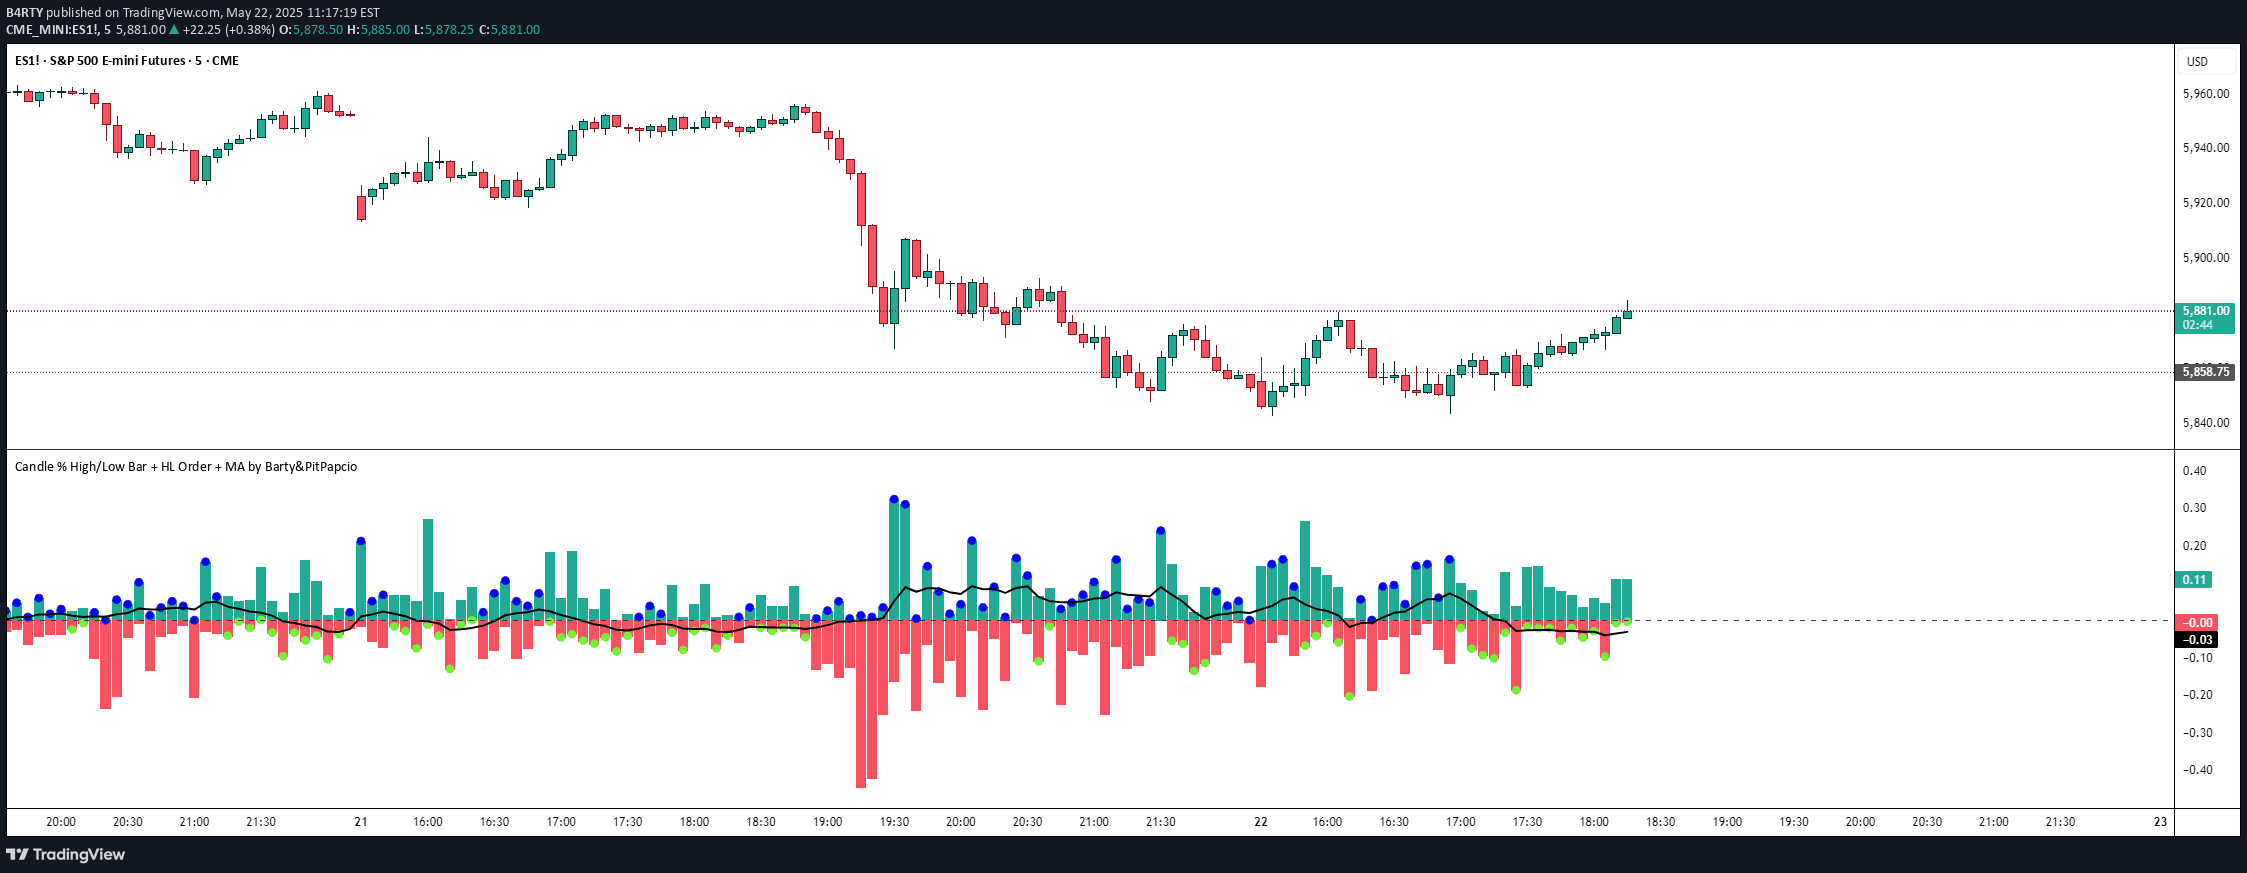
A Pine Script indicator that identifies potential market reversals through liquidity sweeps, detecting price movements beyond previous candle boundaries with optional EMA trend visualization.
Explore complementary indicator rolesHow it works
The indicator analyzes price action by detecting liquidity sweeps where the current candle moves beyond the previous candle's high or low and then closes on the opposite side of the previous candle's wick. For bullish sweeps, the price drops below the previous candle's low and then closes above its high, signaling a potential upward reversal.
Conversely, bearish sweeps occur when the price rises above the previous candle's high and then closes below its low. An optional EMA (Exponential Moving Average) is plotted to provide visual trend context, helping traders understand the broader market direction. While the EMA does not directly generate signals, it serves as a supplementary tool for trend analysis, with its default setting at 50 periods to capture medium-term market movements.
Why it may be useful
Liquidity sweep signals are crucial for traders because they reveal potential market turning points by identifying moments when price action suggests a possible reversal or significant momentum shift. These signals capture scenarios where market participants might be trapped in losing positions, creating opportunities for traders to enter countertrend positions with potentially favorable risk-reward ratios.
The indicator's ability to detect these nuanced price movements provides traders with a strategic advantage in understanding market psychology and potential trend changes. By focusing on price action and liquidity dynamics, traders can gain insights into market sentiment and potential future price movements without relying on complex, lagging indicators.
When to explore it
The liquidity sweep indicator is most effective in trending markets with clear directional movements, particularly on longer timeframes like 30-minute, 1-hour, 4-hour, and daily charts. Traders should look for these signals when the market shows signs of potential reversal or when price action suggests a possible trend continuation after a liquidity grab.
Optimal usage involves combining this indicator with other confirmation tools such as volume analysis, support and resistance levels, or additional momentum indicators. Traders should be cautious and wait for additional confirmation before entering trades, as not all liquidity sweeps result in significant price reversals.
Keep exploring
What we’ve verified
Access, alerts and repainting behaviour have not been independently verified for this indicator. Check the creator’s current publication and settings.
General descriptions and classifications are recovered research. Verified details above identify the specific checks we have completed. Check the creator’s current publication for later changes.