
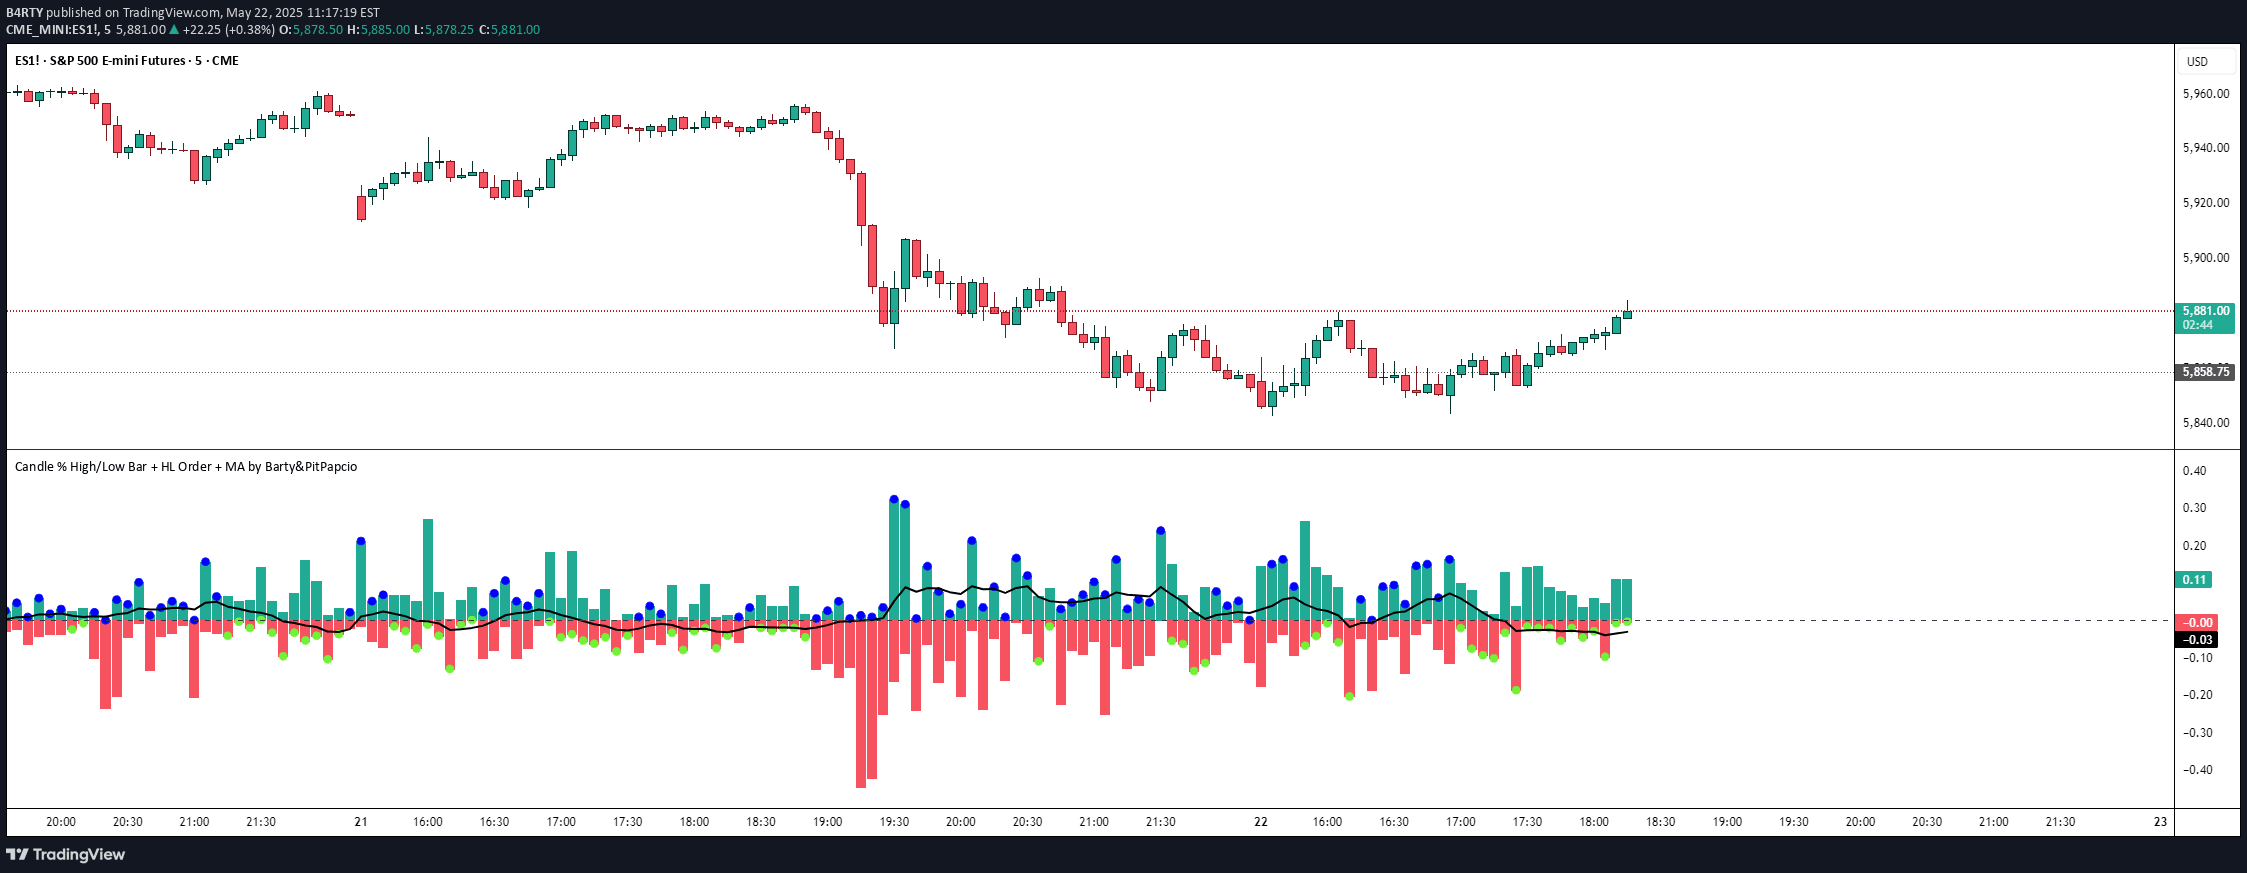
A unique candle analysis tool showing percentage movement from open price and identifying first high/low timing across multiple timeframes, revealing market directional pressures.
Explore complementary indicator rolesHow it works
The indicator calculates percentage deviations of candle highs and lows relative to the open price, creating visual bars that display price movement magnitude. Each bar represents the percentage change from the opening price, with bars above zero indicating upward movement and bars below zero showing downward movement.
Additionally, the tool retrieves first high/low timing from a lower timeframe, placing a dot above or below each bar to indicate whether the high or low was reached first. A customizable moving average (EMA, SMA, or WMA) is then applied to these high/low signals to help traders identify underlying trend dynamics.
Why it may be useful
This indicator provides traders with a nuanced view of price movement beyond traditional price charts, offering insights into market psychology and momentum. By visualizing percentage deviations and first high/low timing, traders can better understand the subtle dynamics of price action and potential trend reversals.
The moving average component further enhances analysis by smoothing the sequence of high/low signals, revealing underlying directional tendencies that might be obscured in standard price charts. This additional layer of information can help traders make more informed decisions about market entry and exit points.
When to explore it
The indicator works best in volatile markets where understanding quick price movements and directional pressures is crucial. It is particularly useful for short-term traders who need to quickly assess market sentiment and potential trend changes within a single trading session.
Traders should combine this tool with other technical indicators like RSI, momentum oscillators, or support/resistance levels to confirm signals and reduce false positives. Its effectiveness increases when used across multiple timeframes, allowing for a comprehensive view of price action dynamics.
Keep exploring
What we’ve verified
Access, alerts and repainting behaviour have not been independently verified for this indicator. Check the creator’s current publication and settings.
General descriptions and classifications are recovered research. Verified details above identify the specific checks we have completed. Check the creator’s current publication for later changes.


