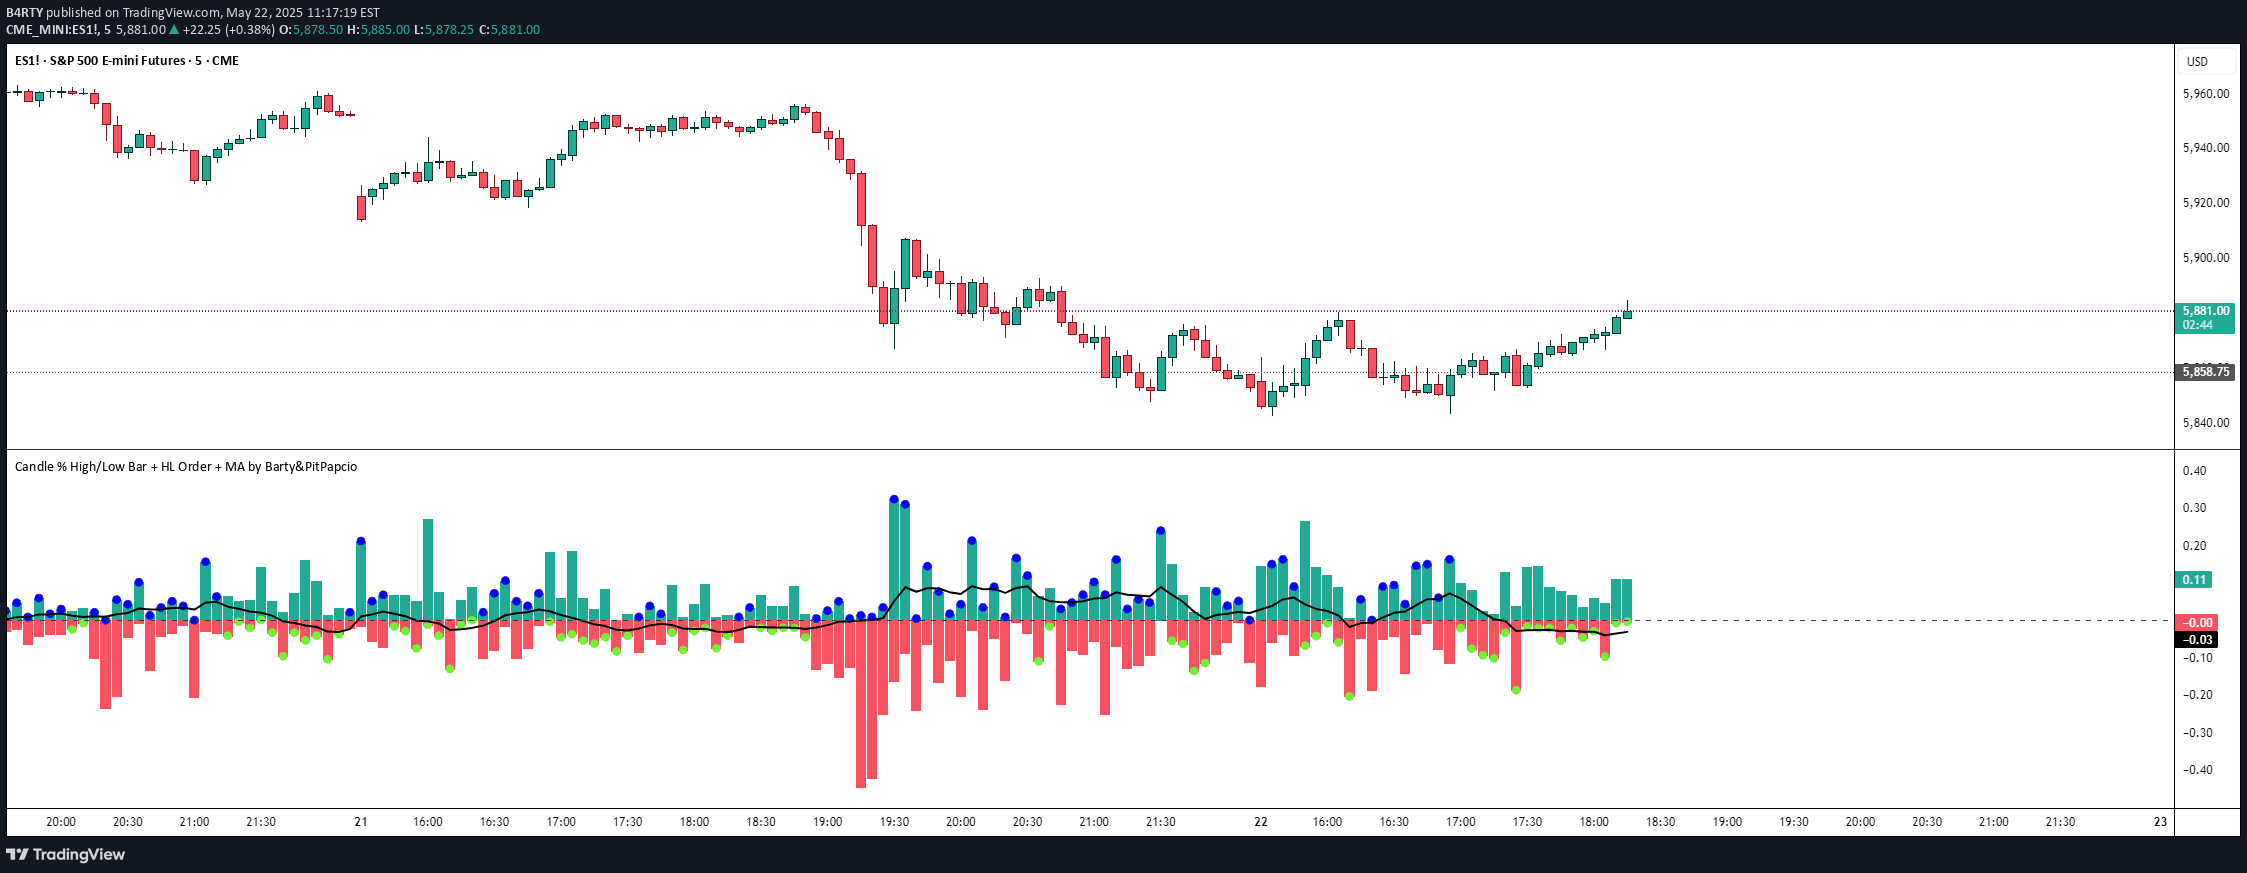
A technical strategy combining RSI momentum with candlestick patterns and moving average trend confirmation to generate dynamic buy and sell signals across different markets.
Explore complementary indicator rolesHow it works
The Chakra RISS Engulfing Candlestick Strategy uses the Relative Strength Index (RSI) to detect momentum shifts in market trends. When the RSI crosses specific threshold levels, it generates potential buy or sell signals, with additional confirmation required from price position relative to the 50-period Simple Moving Average (SMA).
The strategy employs color-coded bars to visually represent market conditions, with green bars indicating bullish momentum and red bars signaling bearish momentum. Buy signals occur when RSI rises above the designated level and price is above the SMA, while sell signals trigger when RSI drops below the level and price is below the SMA.
Why it may be useful
This strategy provides traders with a comprehensive approach to market analysis by combining multiple technical indicators to reduce false signals and improve trade accuracy. By integrating momentum, trend, and price action indicators, traders can make more informed decisions about market entry and exit points.
The dynamic color-coding and alert system help traders quickly identify potential trading opportunities across different markets and timeframes. The built-in risk management features, including stop loss and take profit levels, further enhance the strategy's utility by providing structured trade management.
When to explore it
The Chakra RISS strategy is most effective in markets with clear trending characteristics and sufficient liquidity. It performs optimally in volatile environments where rapid momentum shifts can be quickly identified and acted upon by traders seeking to capture short to medium-term price movements.
Traders should consider using this strategy in markets like stocks, forex, and cryptocurrencies, particularly during periods of consistent directional price movement. The strategy's flexibility across different timeframes makes it suitable for scalpers, day traders, and swing traders looking for a robust, multi-dimensional trading approach.
Keep exploring
What we’ve verified
Access, alerts and repainting behaviour have not been independently verified for this indicator. Check the creator’s current publication and settings.
General descriptions and classifications are recovered research. Verified details above identify the specific checks we have completed. Check the creator’s current publication for later changes.