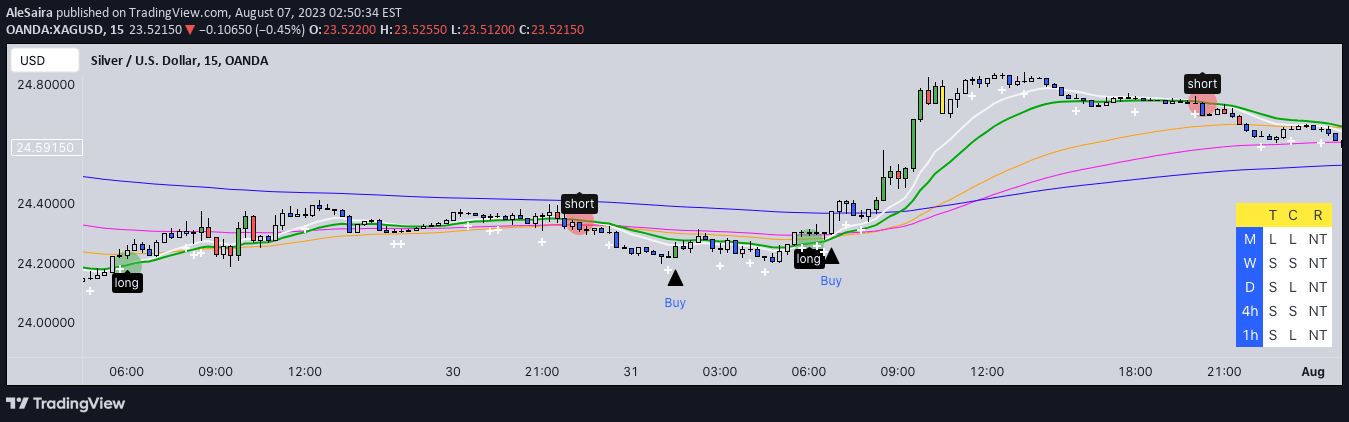
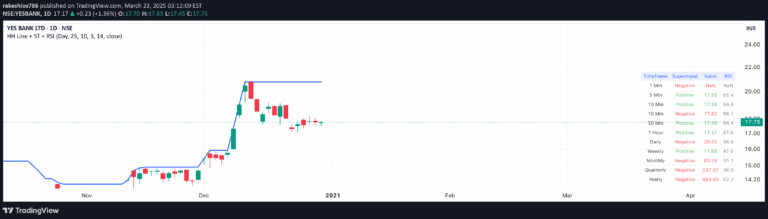
A trading signal that identifies engulfing candles, tracks consecutive signals, and highlights potential trend reversals through candle body size and consecutive pattern recognition.
Explore complementary indicator rolesHow it works
The signal identifies engulfing candles by comparing the body size of consecutive candles, requiring the new candle to be over 100% larger than the previous opposite candle. It tracks the number of consecutive bullish or bearish signals, marking the third signal in blue and the fourth in yellow to highlight potential momentum shifts.
The script specifically checks for true engulfing conditions, avoiding piercing candles where the open price falls within the previous candle's body. It maintains a count of consecutive signals across different timeframes, providing traders with a visual representation of potential trend developments.
Why it may be useful
Engulfing candle signals are crucial for traders as they provide early indications of potential trend reversals or momentum changes. By tracking the size and sequence of candles, traders can gain insights into market sentiment and potential price movements that might not be immediately apparent.
The color-coded consecutive signals help traders filter out market noise and identify more significant trend developments. This approach allows for a more nuanced understanding of market dynamics, particularly on lower timeframes where price action can be more volatile and complex.
When to explore it
This signal works best on standard candlestick charts with clear, distinct candle formations. It is particularly useful for traders looking to identify potential trend reversals or momentum shifts in active, volatile markets where quick price changes are common.
The signal is most effective when used in conjunction with other technical analysis tools, as it provides a visual and quantitative approach to understanding price action. Traders should be cautious on higher timeframes, as the third and fourth consecutive signals may sometimes act as false signals or fake-outs before a potential trend reversal.
Keep exploring
What we’ve verified
Access, alerts and repainting behaviour have not been independently verified for this indicator. Check the creator’s current publication and settings.
General descriptions and classifications are recovered research. Verified details above identify the specific checks we have completed. Check the creator’s current publication for later changes.