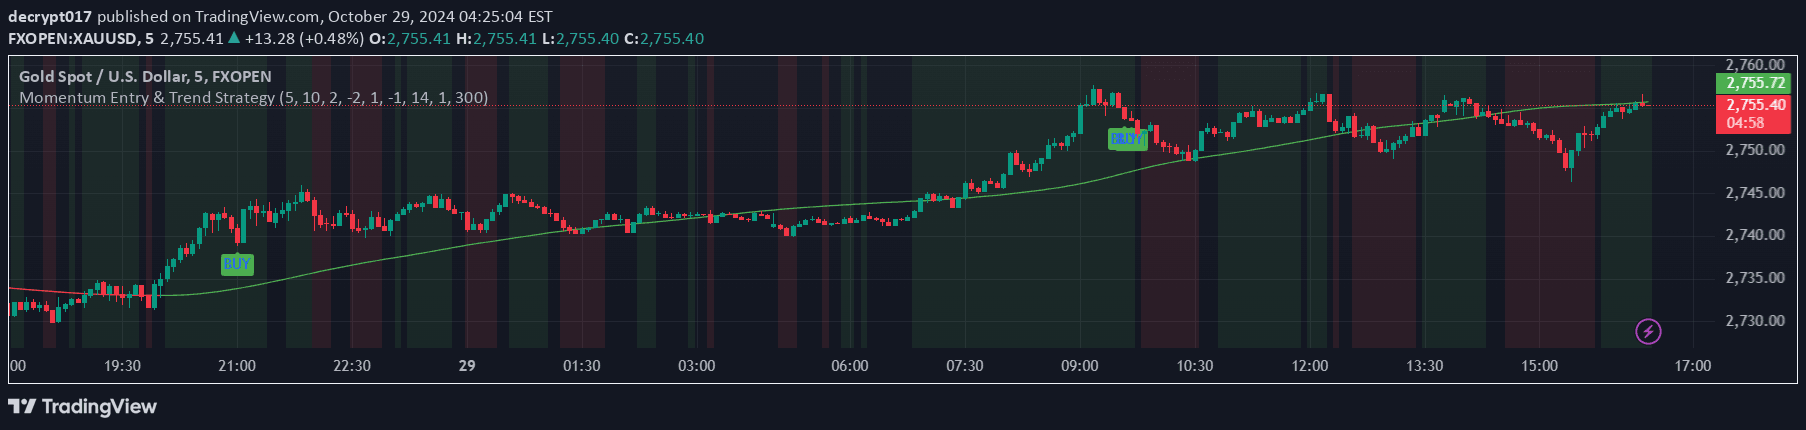
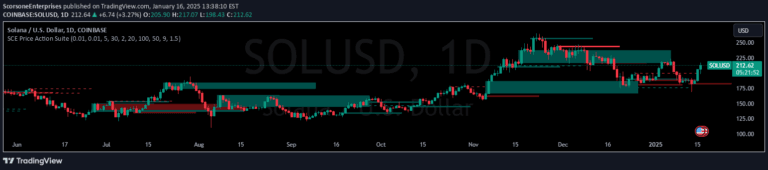
A trading indicator that analyzes price trend streaks to predict potential bullish or bearish momentum and identify possible trend continuation or reversal zones.
Explore complementary indicator rolesHow it works
The indicator calculates up and down streaks by tracking consecutive bullish or bearish candles within a specified period. It examines each candle's closing price to determine whether it is bullish or bearish, counting the number of consecutive candles in a particular trend.
By comparing the current streak length to the average streak length over the defined period, the indicator generates insights about potential trend continuation or reversal. It provides visual signals and predictions about the likely direction of the next candle based on the comparison between current and historical streak patterns.
Why it may be useful
The indicator helps traders understand market momentum by revealing the typical length and behavior of price trends. By providing insights into streak patterns, traders can gain a more nuanced understanding of market dynamics and potential trend reversals.
This approach allows traders to make more informed decisions about market entry and exit points. The visual signals and predictive elements help traders identify potential opportunities and assess the strength and sustainability of current market trends.
When to explore it
The indicator is most effective in markets with clear trending behavior, where price movements tend to exhibit consistent directional momentum. It works particularly well in markets with defined bullish or bearish trends, helping traders identify potential continuation or reversal points.
Traders should use this indicator in conjunction with other technical analysis tools to confirm signals and reduce false predictions. It is especially useful for swing traders and day traders looking to capture multi-candle trend movements and potential trend transition points.
Keep exploring
What we’ve verified
Access, alerts and repainting behaviour have not been independently verified for this indicator. Check the creator’s current publication and settings.
General descriptions and classifications are recovered research. Verified details above identify the specific checks we have completed. Check the creator’s current publication for later changes.