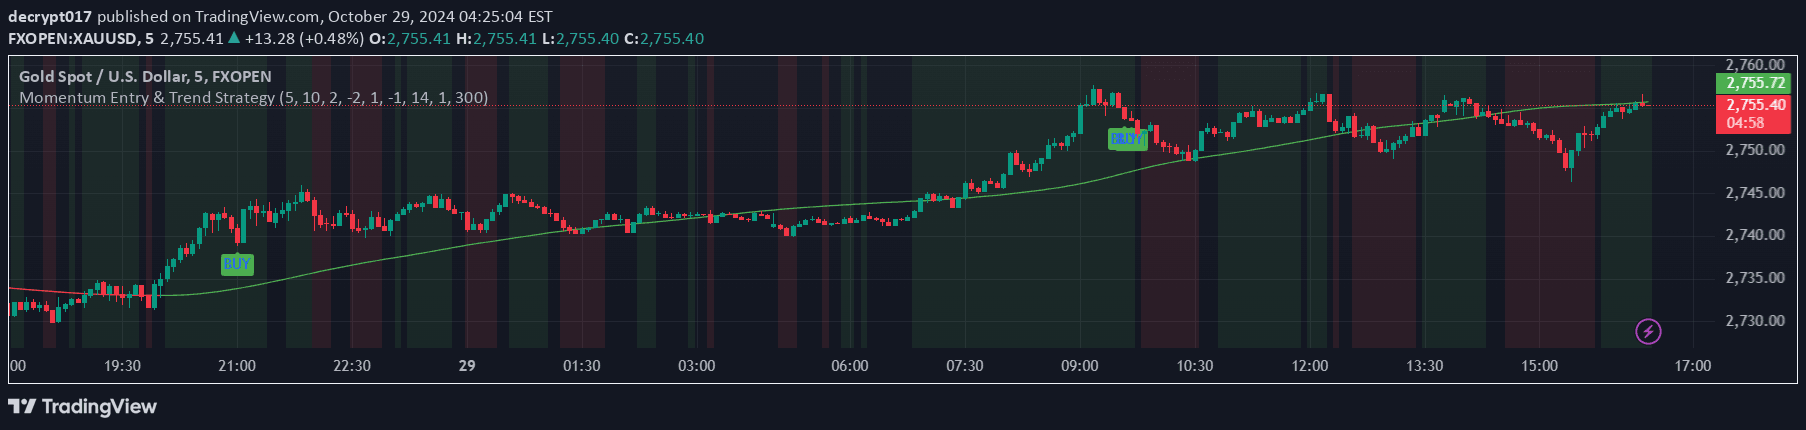
A comprehensive trading script using multiple technical indicators including EMAs, RSI, and MACD to identify market trends, momentum, and potential trading opportunities across different timeframes.
Explore complementary indicator rolesHow it works
The trading script analyzes price action through multiple technical indicators simultaneously, calculating exponential moving averages across different periods to establish trend direction and strength. It integrates moving average crossovers, momentum oscillators like RSI and MACD, and identifies key candlestick patterns to generate comprehensive trading signals.
By dynamically plotting EMAs for 5, 9, 21, 50, and 200 periods, the script provides traders with a multi-layered view of market trends and potential entry/exit points. The script also detects support and resistance levels, marking significant price zones and highlighting critical candlestick formations that could indicate potential market reversals or continuation patterns.
Why it may be useful
Technical analysis tools help traders make more informed decisions by providing objective, data-driven insights into market behavior and potential price movements. By combining multiple indicators, traders can validate signals and reduce the likelihood of false trading opportunities, thereby improving overall strategy reliability.
The comprehensive approach of integrating trend, momentum, and pattern recognition allows traders to develop a more holistic understanding of market dynamics. This multifaceted analysis helps mitigate individual indicator limitations and provides a more robust framework for identifying high-probability trading scenarios across different market conditions.
When to explore it
This trading script is most effective in markets with clear trending characteristics, where price movements demonstrate consistent directional momentum across multiple timeframes. It performs exceptionally well in liquid markets with sufficient trading volume, such as major stock indices, forex pairs, and actively traded commodities.
Traders should apply this script during periods of stable market volatility, avoiding extremely choppy or news-driven market conditions that can generate conflicting signals. It is particularly useful for traders seeking a comprehensive, multi-indicator approach to technical analysis that combines trend identification, momentum assessment, and pattern recognition.
Keep exploring
What we’ve verified
Access, alerts and repainting behaviour have not been independently verified for this indicator. Check the creator’s current publication and settings.
General descriptions and classifications are recovered research. Verified details above identify the specific checks we have completed. Check the creator’s current publication for later changes.