
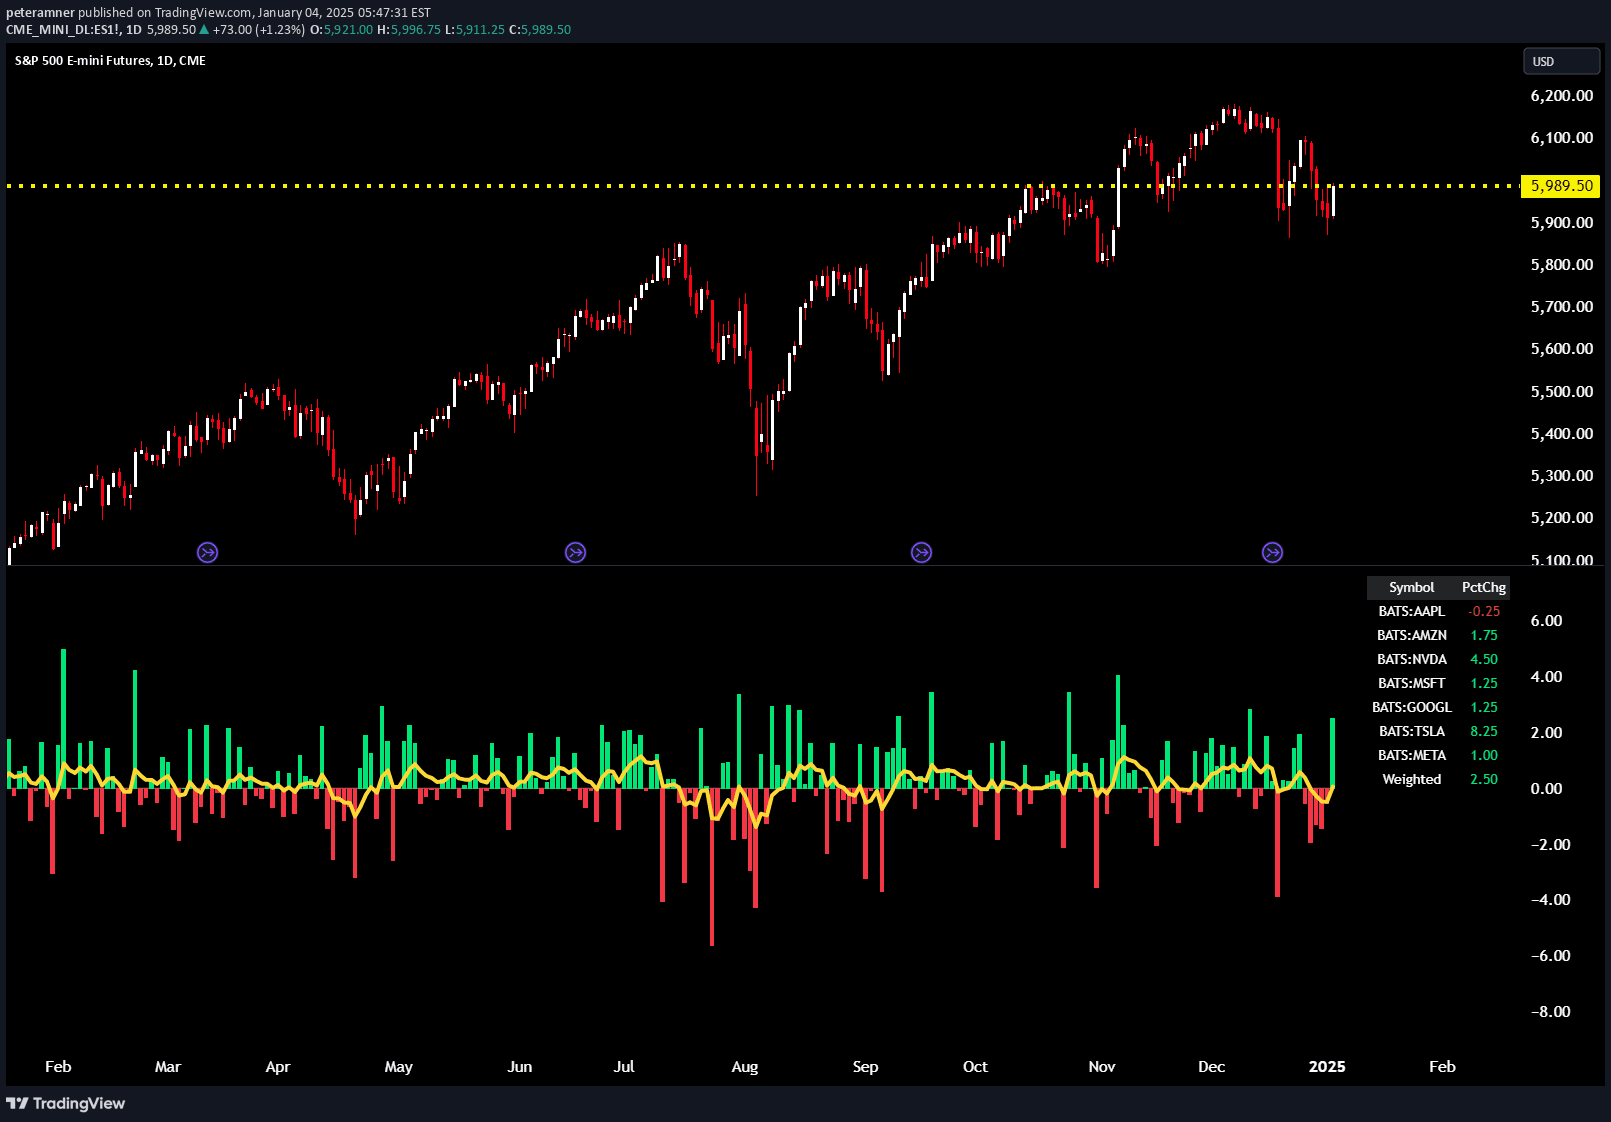
A multi-symbol momentum indicator that aggregates weighted percentage changes across selected stocks to provide a comprehensive view of collective market movement and trend strength.
Explore complementary indicator rolesHow it works
The weighted momentum indicator calculates percentage changes for multiple selected stocks, assigning custom weights to each symbol to create a comprehensive market sentiment metric. Each stock's individual price movement is multiplied by its assigned weight, then aggregated into a single momentum value represented by color-coded histogram bars.
The raw momentum is further enhanced by overlaying a smoothed Exponential Moving Average (EMA) line, which helps traders visualize short-term momentum trends and identify potential acceleration or deceleration in market movement across the selected stock basket.
Why it may be useful
This indicator provides traders with a holistic view of market momentum by combining multiple stock performances into a single, easily interpretable metric. By allowing custom weighting, traders can emphasize stocks they believe are more significant or representative of broader market trends, creating a more nuanced momentum analysis.
The color-coded histogram and smoothed EMA line offer quick visual insights into collective market sentiment, helping traders rapidly assess whether the selected stock basket is experiencing positive or negative momentum relative to recent performance.
When to explore it
The weighted momentum indicator is most effective when analyzing a basket of correlated stocks within a specific sector or market segment, such as technology, healthcare, or large-cap equities. Traders can use this tool to gauge overall sector sentiment and identify potential trend shifts across multiple related securities.
It is particularly useful during periods of market rotation, sector transitions, or when seeking a broader perspective on market movement beyond individual stock performance. Traders should combine this indicator with other technical and fundamental analysis for more comprehensive trading decisions.
Keep exploring
What we’ve verified
Access, alerts and repainting behaviour have not been independently verified for this indicator. Check the creator’s current publication and settings.
General descriptions and classifications are recovered research. Verified details above identify the specific checks we have completed. Check the creator’s current publication for later changes.


