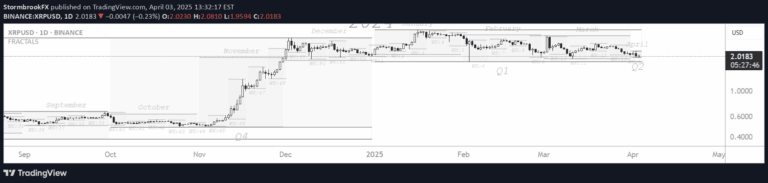
A trigonometric-based indicator that uses Taylor Series approximations to analyze price movements, providing a smoothed mathematical component with dynamic scaling.
Explore complementary indicator rolesHow it works
The indicator begins by calculating sine and cosine values of the close price using Taylor Series approximations, which create polynomial estimates of trigonometric functions. These calculated values are then multiplied together to generate a primary mathematical component called the 'trigComponent'.
This trigComponent undergoes smoothing through a simple moving average to reduce market noise and enhance responsiveness to genuine price movements. A natural logarithm approximation is then applied, ensuring positive values and providing a different interpretative scale for the smoothed component.
Why it may be useful
By leveraging trigonometric approximations, this indicator offers a unique perspective on price dynamics that differs from traditional technical analysis methods. Its mathematical foundation allows for nuanced insights into market behavior, potentially revealing underlying trends that might be missed by conventional indicators.
The dynamic scaling and smoothing processes help traders filter out market noise and focus on meaningful price movements. This approach can provide more reliable signals by transforming raw price data into a more interpretable format.
When to explore it
This indicator is most effective in markets with clear, trending characteristics where trigonometric transformations can reveal underlying price momentum. It works particularly well in shorter timeframes like scalping and day trading, where quick, precise insights are crucial for decision-making.
Traders should consider using this signal when seeking a mathematically robust method of trend analysis that goes beyond traditional price-based indicators. It is especially useful in volatile markets where standard technical tools might produce less reliable signals.
Keep exploring
What we’ve verified
Access, alerts and repainting behaviour have not been independently verified for this indicator. Check the creator’s current publication and settings.
General descriptions and classifications are recovered research. Verified details above identify the specific checks we have completed. Check the creator’s current publication for later changes.