Opening Range with Breakouts & Targets [LuxAlgo]
An advanced trading strategy measuring the opening range of a trading session to identify potential breakout opportunities and determine market trend direction with precise entry and exit points.
Explore 11,183 indicators. Filter beyond the obvious.
Discover the tools that fit the way you trade.
11,183 tools to explore
An advanced trading strategy measuring the opening range of a trading session to identify potential breakout opportunities and determine market trend direction with precise entry and exit points.
Renko Candles Overlay is a charting technique that transforms price action into uniform-sized bricks, offering a simplified visual representation of market trends and price movements.
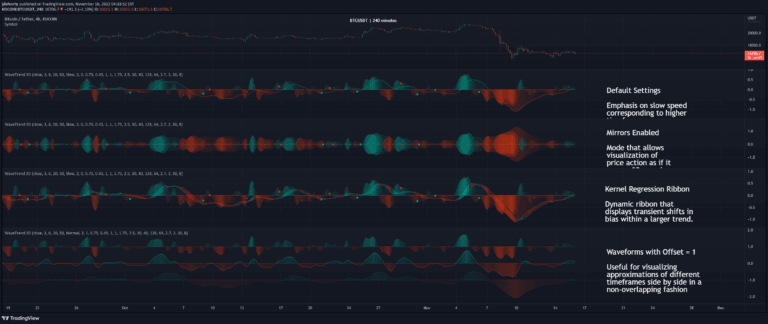
WaveTrend 3D is an advanced oscillator that uses digital signal processing and machine learning techniques to analyze price trends with enhanced precision and multi-timeframe support.
A multi-period moving average indicator that provides trend strength and direction analysis through color-coded lines and histogram visualization, helping traders identify market momentum and potential entry points.
A multi-harmonic trigonometric model that extrapolates price trends using Fourier series and Quinn-Fernandes algorithm for predicting future price movements and cycles.
A comprehensive trend and strength indicator that uses moving averages and standard deviation to identify market trends, providing color-coded signals and a dynamic strength gauge for traders.
A unique trading tool that overlays momentum oscillators within a logarithmic regression channel, providing dynamic insights into price trends and momentum positioning.
A unique RSI indicator that transforms traditional RSI into candlesticks, providing deeper insights into price action and momentum through advanced visualization techniques.
RSI-Divergence Goggle is an innovative trading indicator that plots RSI directly on the price chart, enabling comprehensive divergence analysis with interactive features.
Osmosis is a multi-indicator heatmap that visualizes market trends across different time periods, revealing potential trend reversals and significant market movements.
A composite EMA indicator that compares an asset's closing price with the XU100 index, scaling EMA values to provide unique market trend and support/resistance insights.
A Renko RSI tool that calculates momentum using custom Renko chart methodology, filtering price noise and focusing on significant price movements across different timeframes.
Likes, views, and comments are historical TradingView snapshots. They describe attention, not trading performance.