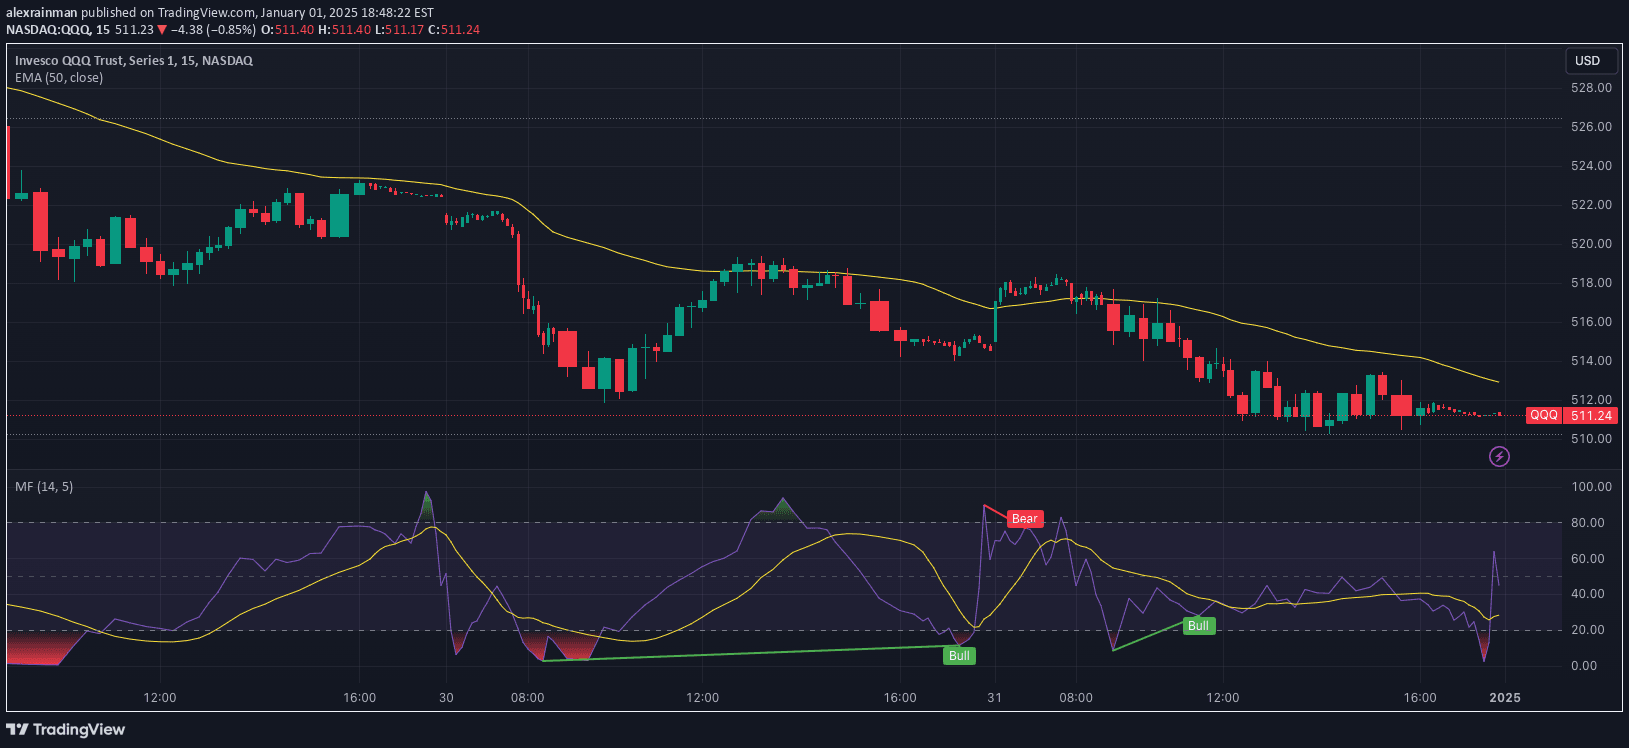
A unique RSI indicator that transforms traditional RSI into candlesticks, providing deeper insights into price action and momentum through advanced visualization techniques.
Explore complementary indicator rolesHow it works
The RSI Candlestick Oscillator transforms the traditional RSI by introducing Open, High, Low, and Close values to create a more dynamic representation of price momentum. It uses a sophisticated scaling method to map RSI values onto a candlestick format, allowing traders to see precise intrabar movements and interactions with RSI levels.
By generating candlesticks within the RSI oscillator, the indicator creates a more nuanced view of price action. It calculates RSI values using a specific length and translates these values into candlesticks that closely mirror the original price chart, enabling traders to detect subtle changes in momentum and trend strength.
Why it may be useful
Traditional RSI indicators often provide limited insights by showing a single line or value, whereas this candlestick-based RSI offers a more comprehensive view of market momentum. By displaying RSI as candlesticks, traders can identify more precise entry and exit points, understand price action dynamics, and detect potential trend reversals with greater accuracy.
The indicator's ability to overlay divergences on both the RSI oscillator and price chart provides traders with a powerful tool for analyzing market movements. Its advanced filtering mechanism helps focus on the most significant divergences, reducing noise and improving the quality of trading signals.
When to explore it
The RSI Candlestick Oscillator is most effective in markets with clear momentum shifts and when traders want to gain deeper insights into price action dynamics. It works exceptionally well in trending markets where momentum changes are frequent and significant, helping traders identify potential reversals and continuation patterns.
Traders should utilize this indicator across various timeframes, from scalping to swing trading, to validate momentum signals and confirm potential trade setups. It is particularly useful when combined with other technical analysis tools, providing an additional layer of confirmation for trading decisions.
Keep exploring
What we’ve verified
Access, alerts and repainting behaviour have not been independently verified for this indicator. Check the creator’s current publication and settings.
General descriptions and classifications are recovered research. Verified details above identify the specific checks we have completed. Check the creator’s current publication for later changes.