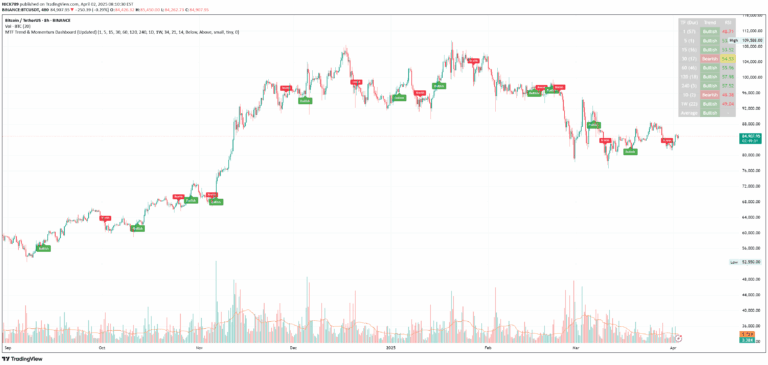
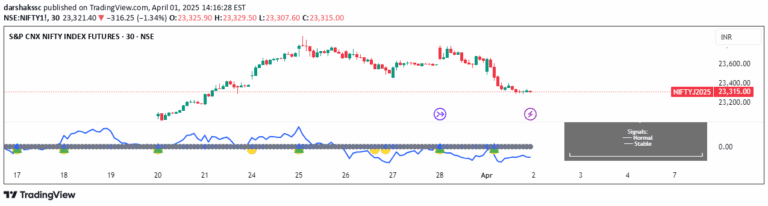
Osmosis is a multi-indicator heatmap that visualizes market trends across different time periods, revealing potential trend reversals and significant market movements.
Explore complementary indicator rolesHow it works
Osmosis operates by analyzing price and volume data across multiple lookback periods, creating a comprehensive heatmap that normalizes indicators using min/max scaling. The indicator arranges periods from shortest to longest, with the bottom representing short-term movements and the top representing long-term trends.
Each period is color-coded and scaled, allowing traders to see how different timeframes interact and potentially signal market shifts. The tool automatically highlights exceptional high or low regions, drawing attention to significant market movements or potential anomalies within the trend analysis.
Why it may be useful
The Osmosis indicator provides traders with a nuanced, multi-dimensional view of market trends that goes beyond traditional single-timeframe analysis. By visualizing trends across different periods simultaneously, traders can gain deeper insights into potential trend strength, weakness, and possible reversal points.
Its unique approach of normalizing and color-coding different periods helps traders quickly identify complex market dynamics that might be missed by conventional indicators, offering a more comprehensive understanding of price and volume interactions.
When to explore it
Osmosis is most effective when traders want to analyze complex market trends across multiple timeframes and gain a holistic view of potential market movements. It works particularly well in volatile markets where trend identification can be challenging, providing a comprehensive visualization of price and volume dynamics.
The indicator is especially useful during periods of market uncertainty, when traders need to understand both short-term and long-term trend characteristics. By revealing potential trend reversals and highlighting significant market movements, Osmosis can help traders make more informed decisions about entry and exit points.
Keep exploring
What we’ve verified
Access, alerts and repainting behaviour have not been independently verified for this indicator. Check the creator’s current publication and settings.
General descriptions and classifications are recovered research. Verified details above identify the specific checks we have completed. Check the creator’s current publication for later changes.