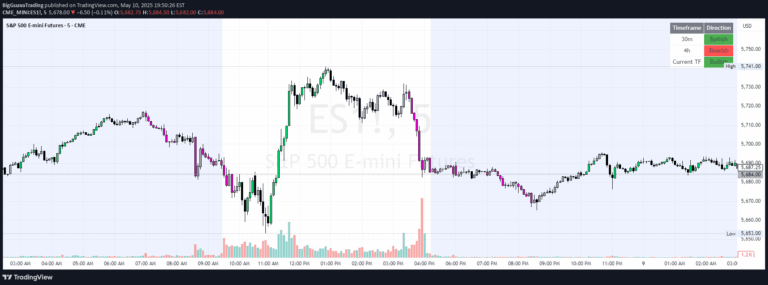
A multi-timeframe dashboard that analyzes trend direction and momentum across nine different timeframes, providing traders with comprehensive market insights and visual trend indicators.
Explore complementary indicator rolesHow it works
The indicator analyzes nine timeframes simultaneously using a combination of exponential moving average (EMA) and simple moving average (SMA) to detect market trends. It calculates trend direction by comparing short-term and long-term moving averages, determining whether the market is bullish, bearish, or neutral.
The system tracks trend duration by counting consecutive bars in the same trend direction. Additionally, it computes the Relative Strength Index (RSI) for each timeframe and color-codes the results to visually represent market momentum and potential trend changes
Why it may be useful
This multi-timeframe analysis tool provides traders with a comprehensive view of market conditions across different time horizons. By consolidating trend and momentum information into a single, easy-to-read dashboard, traders can quickly assess market dynamics without switching between multiple charts.
The color-coded RSI and trend duration indicators help traders identify potential trend reversals, confirm existing trends, and make more informed trading decisions. Its visual approach simplifies complex market analysis and supports more strategic trading strategies
When to explore it
The indicator is most effective for traders who want a holistic market perspective across multiple timeframes. It works best during trending markets with clear directional movements, helping traders confirm trend strength and potential reversals.
Swing traders and day traders will find it particularly useful for identifying consistent trend directions and momentum shifts. The tool is especially valuable when markets show transitional characteristics or when traders need to validate trends across different time horizons before making trading decisions
Keep exploring
What we’ve verified
Access, alerts and repainting behaviour have not been independently verified for this indicator. Check the creator’s current publication and settings.
General descriptions and classifications are recovered research. Verified details above identify the specific checks we have completed. Check the creator’s current publication for later changes.