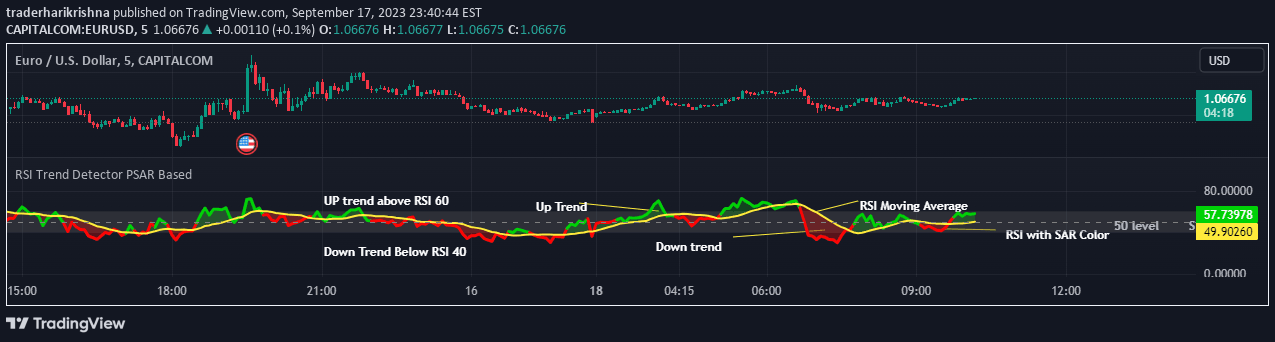
A price ratio indicator that compares an asset's price to its moving average, revealing market conditions, trend strength, and potential reversals using customizable moving average types.
Explore complementary indicator rolesHow it works
The Price Ratio Indicator calculates the relationship between an asset's price and its selected moving average by computing a ratio and subtracting 1. It uses various moving average types like EMA, SMA, and HMA to create a flexible analysis framework that smooths price data and reveals underlying market dynamics.
The indicator transforms the raw price ratio through signal line smoothing, which helps filter out market noise and provides a clearer view of price momentum. By adjusting parameters like moving average length and signal line settings, traders can customize the indicator to match different market conditions and trading styles.
Why it may be useful
This indicator offers traders a nuanced perspective on price movements by revealing the precise relationship between current price and its moving average. It helps identify potential overbought and oversold conditions, providing early warning signals for possible trend reversals and market sentiment shifts.
By visualizing price dynamics through color gradients and dynamic bar coloring, the indicator makes complex market information more accessible and interpretable. Traders can quickly assess market momentum, strength of trends, and potential entry or exit points, enhancing their decision-making process.
When to explore it
The Price Ratio Indicator is most effective in markets with clear trending characteristics, where price movements show consistent directional momentum. It performs exceptionally well in liquid markets with sufficient trading volume, allowing for more reliable signal generation and trend identification.
Traders should apply this indicator across multiple timeframes, from short-term scalping to longer-term swing trading, adjusting input parameters to match specific market conditions. It is particularly useful during periods of market transition, helping traders detect early signs of trend changes and potential reversals.
Keep exploring
What we’ve verified
Access, alerts and repainting behaviour have not been independently verified for this indicator. Check the creator’s current publication and settings.
General descriptions and classifications are recovered research. Verified details above identify the specific checks we have completed. Check the creator’s current publication for later changes.