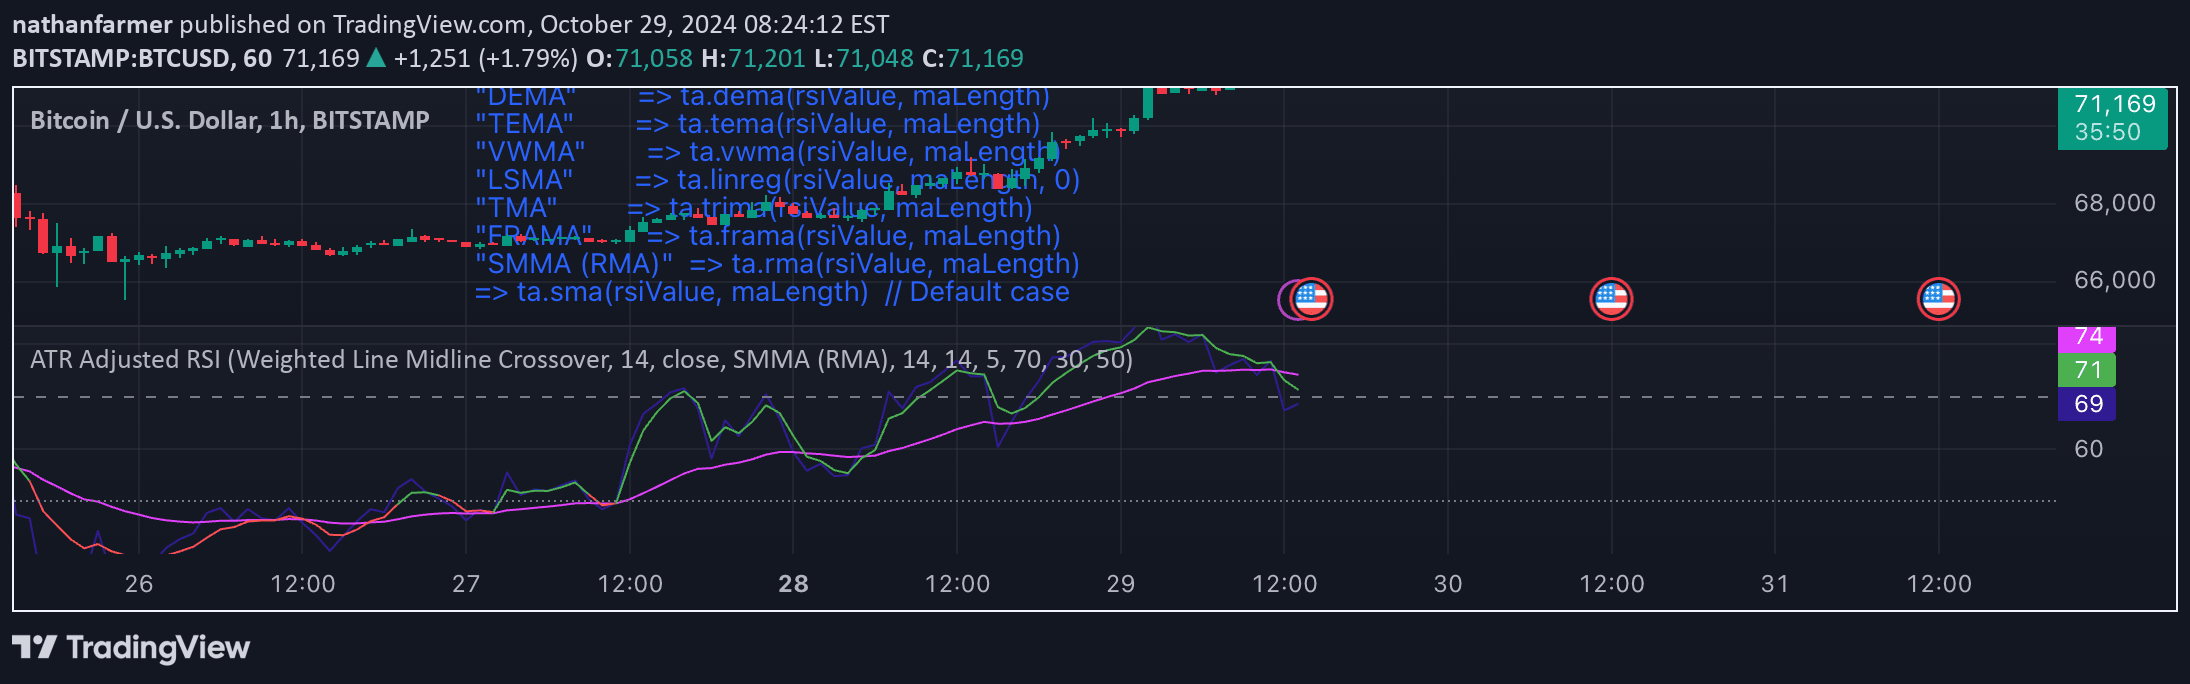
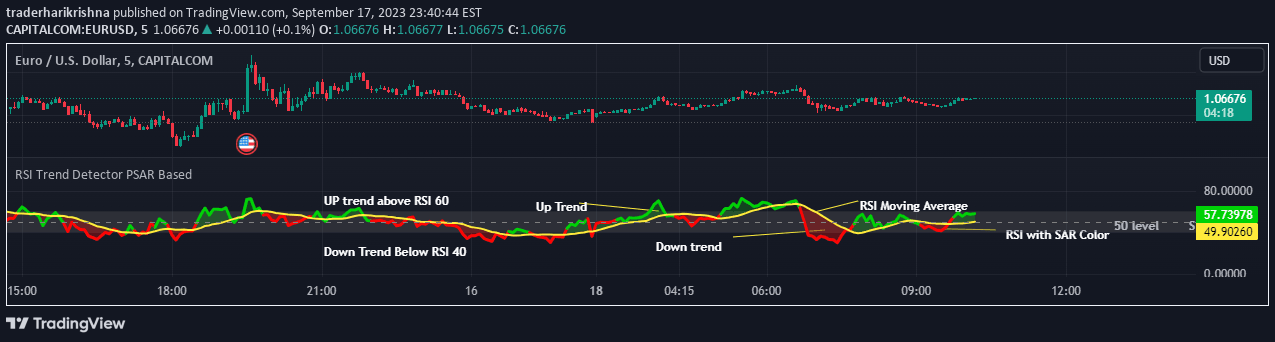
A unique technical indicator that calculates a modified average using price scale and RSI profile to provide insights into market dynamics and potential trading opportunities.
Explore complementary indicator rolesHow it works
The Rough Average indicator begins by determining the approximate scale of the price through a mathematical process that identifies the most representative power of 10. This step helps reduce lag and improve output smoothing. The indicator then calculates a profile value by summing the absolute values of the Relative Strength Index (RSI) of closing prices over a specified period.
After establishing the profile, the indicator applies an Exponential Moving Average (EMA) to smooth the calculated values. The EMA emphasizes recent price data, creating a modified average that can reveal underlying market trends and dynamics. This approach allows the indicator to provide a unique perspective on price movements by combining scale analysis and momentum indicators.
Why it may be useful
The Rough Average indicator offers traders a sophisticated alternative to traditional market analysis by providing a nuanced view of price movements and market conditions. By incorporating both scale analysis and momentum indicators, it can help identify potential trends, reversals, and periods of market strength or weakness that might be overlooked by conventional technical tools.
Its unique methodology allows traders to gain deeper insights into market dynamics, potentially revealing hidden patterns and providing a more comprehensive understanding of price behavior. The indicator's flexibility and customizable features make it a valuable addition to a trader's analytical toolkit, enabling more informed decision-making and potentially improving overall trading strategy.
When to explore it
The Rough Average indicator is most effective in markets with clear trending or momentum-driven characteristics, where price movements show consistent directional bias. It performs particularly well in markets experiencing moderate to high volatility, where traditional indicators might struggle to provide clear signals. Traders can benefit from using this indicator across various timeframes and asset classes.
Optimal usage occurs when the indicator is combined with other technical analysis tools, such as support and resistance levels, trend lines, or complementary momentum indicators. By integrating the Rough Average with additional confirmatory signals, traders can increase the reliability of their trading decisions and potentially identify more precise entry and exit points.
Keep exploring
What we’ve verified
Access, alerts and repainting behaviour have not been independently verified for this indicator. Check the creator’s current publication and settings.
General descriptions and classifications are recovered research. Verified details above identify the specific checks we have completed. Check the creator’s current publication for later changes.