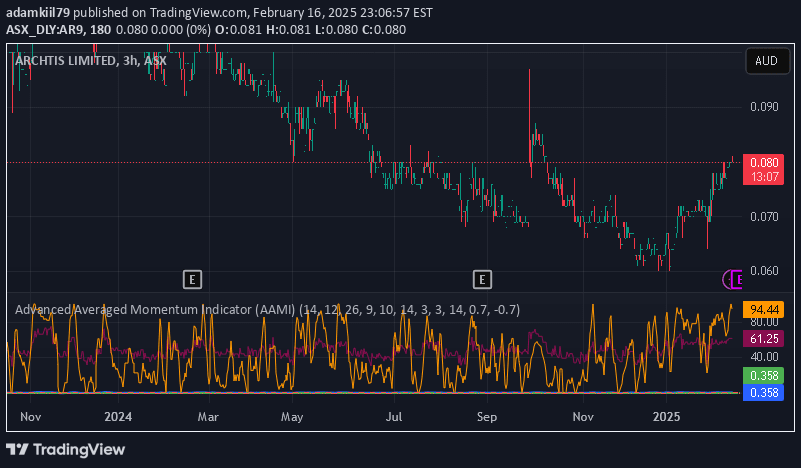
AAMI is a comprehensive momentum indicator that combines multiple normalized technical indicators to provide a unified view of market momentum and potential trend reversals.
Explore complementary indicator rolesHow it works
The Advanced Average Momentum Indicator (AAMI) works by consolidating multiple momentum indicators into a single normalized metric. It averages normalized values from RSI, MACD histogram, raw Momentum, and Stochastic oscillator, transforming each component to a scale from -1 to 1 to ensure equal contribution.
The indicator includes a smoothing mechanism using a Simple Moving Average (SMA) to reduce noise and provide clearer signals. It also incorporates a basic divergence detection mechanism to help traders identify potential trend reversals by comparing the indicator's movement with price action.
Why it may be useful
The AAMI provides traders with a more comprehensive and nuanced view of market momentum by combining multiple technical indicators into a single, easy-to-interpret metric. By normalizing different momentum indicators, it offers a balanced perspective that can help traders make more informed decisions about market conditions.
The indicator's ability to detect potential overbought and oversold conditions, along with its divergence detection feature, makes it a powerful tool for identifying potential entry and exit points. Its customizable nature allows traders to adapt the indicator to different market environments and trading strategies.
When to explore it
The AAMI is most effective in markets with clear momentum trends and during periods of potential trend reversals. Traders can use it to identify overbought and oversold conditions, with values above 0.7 suggesting potential selling opportunities and values below -0.7 indicating potential buying opportunities.
The indicator is particularly useful when crossing the zero line, which can be interpreted as a potential buy or sell signal depending on the direction of the crossover. It works well across different timeframes and can be adapted to various trading styles, making it a versatile tool for momentum-based trading strategies.
Keep exploring
What we’ve verified
Access, alerts and repainting behaviour have not been independently verified for this indicator. Check the creator’s current publication and settings.
General descriptions and classifications are recovered research. Verified details above identify the specific checks we have completed. Check the creator’s current publication for later changes.