Rough Average
A unique technical indicator that calculates a modified average using price scale and RSI profile to provide insights into market dynamics and potential trading opportunities.
Explore 11,183 indicators. Filter beyond the obvious.
Discover the tools that fit the way you trade.
11,183 tools to explore
A unique technical indicator that calculates a modified average using price scale and RSI profile to provide insights into market dynamics and potential trading opportunities.
A trend-following indicator combining William O'Neil's Follow Through Day concept with liquidity analysis to identify potential bullish market reversals and institutional entry points.
An indicator that tracks market price movements by highlighting significant percentage changes, coloring candles to show momentum, and providing visual alerts for price fluctuations.
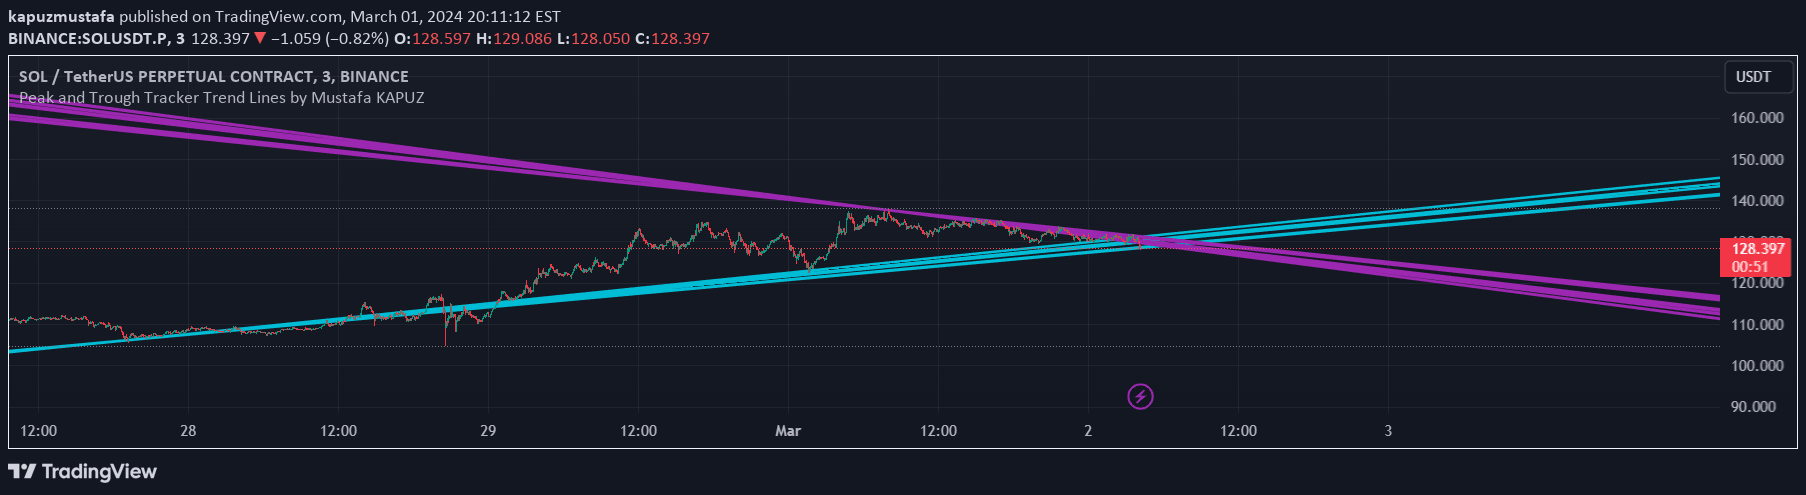
A visual trading tool that tracks peak and trough prices across two time periods, drawing lines to highlight potential support and resistance levels in market movements.
Identifies daily liquidity peaks and troughs by analyzing volume data to highlight significant buying and selling pressure zones for potential market reversals or continuations.
Market Breadth indicator tracking the percentage of S&P 500 stocks above their 200-day moving average, using EMAs to visualize market strength and potential trend reversals.
IBD signal tracking market distribution and follow-through days using volume and price change thresholds to identify potential market trend shifts and confirmations.
An advanced CUSUM indicator that detects price peaks and troughs by measuring cumulative deviations from a moving average, helping identify potential market turning points.
A risk management tool designed for prop firm trading challenges that dynamically adjusts trade size based on account balance while maintaining strict risk parameters.
A Pine Script strategy tracking Follow Through Days in Vietnamese stock market sectors, identifying momentum breakouts across multiple groups to signal potential market reversals.
Likes, views, and comments are historical TradingView snapshots. They describe attention, not trading performance.