
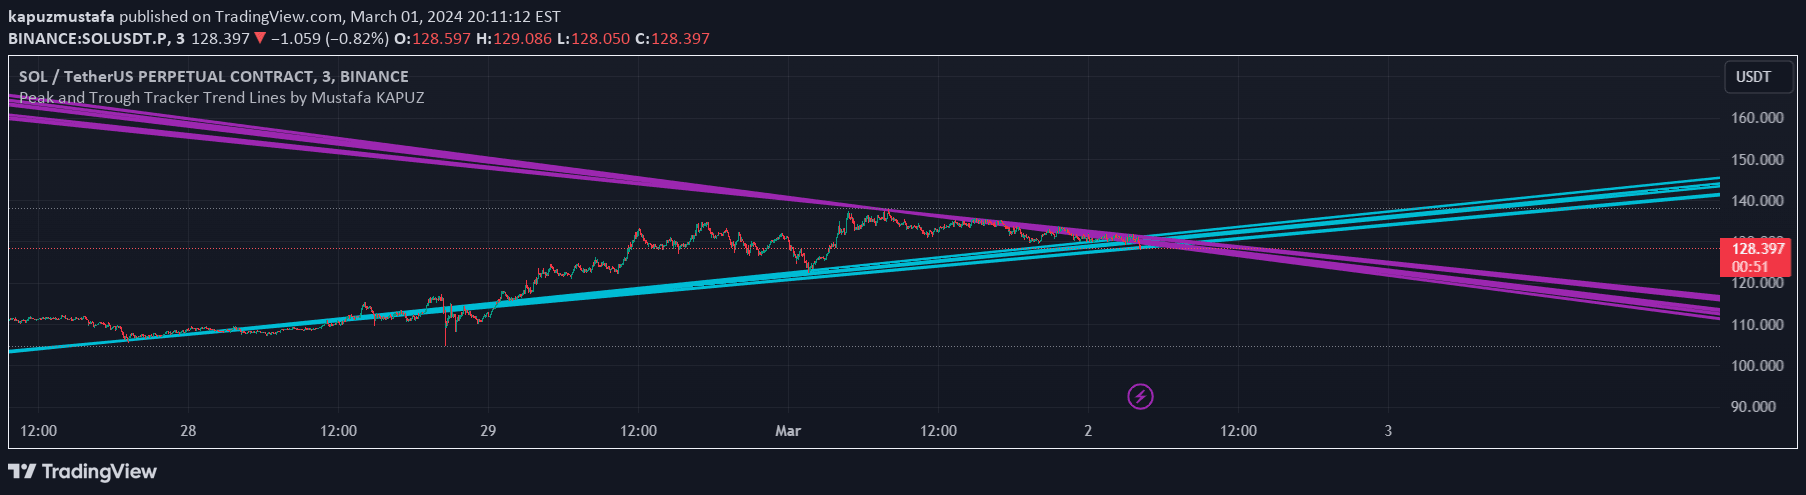
A visual trading tool that tracks peak and trough prices across two time periods, drawing lines to highlight potential support and resistance levels in market movements.
Explore complementary indicator rolesHow it works
The Peak and Trough Tracker operates by analyzing two user-defined time periods to identify the highest and lowest price points within those ranges. It then constructs two distinct lines: a purple line connecting the highest prices and an aqua line linking the lowest prices. These lines extend both into the past and future, creating a visual representation of the market's price extremes.
By plotting these lines across different time frames, the indicator helps traders understand the market's historical price behavior and potential future price movements. The lines serve as dynamic reference points that can reveal underlying trends, potential support and resistance zones, and the overall price trajectory.
Why it may be useful
The Peak and Trough Tracker provides traders with a powerful visual tool for understanding market dynamics and price behavior. By highlighting key turning points, it offers insights into potential support and resistance levels that might not be immediately apparent through traditional price analysis. This can help traders make more informed decisions about entry and exit points.
Moreover, the indicator's ability to extend lines into past and future periods allows for a comprehensive view of market trends. Traders can use these visual cues to anticipate potential price movements, identify trend strengths, and develop more strategic trading approaches across various timeframes and market conditions.
When to explore it
The Peak and Trough Tracker is most effective in markets with clear trending behavior, where price movements show distinct high and low points. It works particularly well in financial instruments that exhibit regular cyclical patterns, such as stocks, forex, and commodities. Traders can benefit from this tool when seeking to understand long-term market trends and potential future price reversals.
This indicator is especially useful during periods of market transition, such as when prices are potentially shifting from an uptrend to a downtrend or vice versa. By providing a visual representation of historical price extremes, it helps traders identify potential entry and exit points, manage risk, and develop more nuanced trading strategies across different market conditions.
Keep exploring
What we’ve verified
Access, alerts and repainting behaviour have not been independently verified for this indicator. Check the creator’s current publication and settings.
General descriptions and classifications are recovered research. Verified details above identify the specific checks we have completed. Check the creator’s current publication for later changes.



