Auto Chart Patterns [Trendoscope®]
An advanced algorithmic indicator that automatically identifies and classifies complex chart patterns by analyzing trend lines, pivot points, and geometric formations across multiple timeframes.
Explore 11,183 indicators. Filter beyond the obvious.
Discover the tools that fit the way you trade.
11,183 tools to explore
An advanced algorithmic indicator that automatically identifies and classifies complex chart patterns by analyzing trend lines, pivot points, and geometric formations across multiple timeframes.
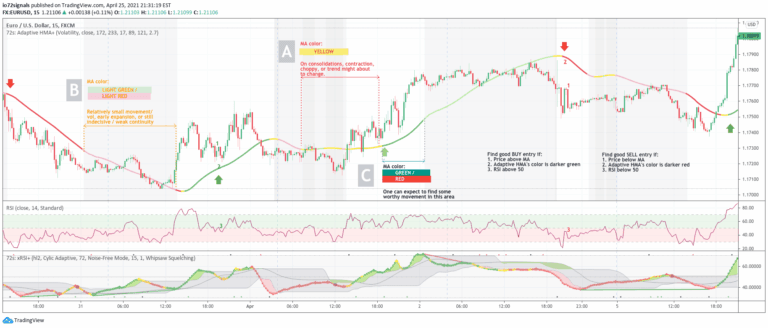
An adaptive Hull Moving Average that dynamically adjusts its period based on volume and volatility, providing clearer trend signals and market condition insights for traders.
Ghost Tangent Crossings is an innovative pivot point indicator that visualizes market movements using ellipses, dynamically tracking zig-zag patterns and potential price breakouts.
MA Sabres is a trend reversal indicator that uses moving averages to detect potential market direction changes and visualize them with sabre-shaped graphical elements.
HyperTrend is a real-time trend estimation indicator that constructs support and resistance channels to help traders identify market direction and potential trading opportunities.
Predictive Channels is a real-time trend channel indicator that estimates supports, resistances, and an average line to help traders understand price movement and potential trend changes.
A trading calendar indicator that displays daily and monthly market sentiment using three different sentiment calculation methods to help traders quickly assess market direction.
A dynamic trend indicator that fits regression lines at different intervals, revealing market trends and potential price channels by calculating linear trends across specified timeframes.
A trend-following system that uses volatility-scaled steps to track market momentum, visualizing trend progression through discrete channels and adaptive volatility bands.
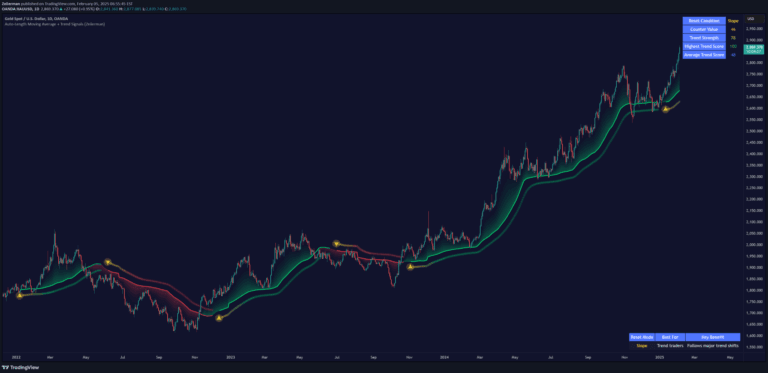
An adaptive moving average indicator that dynamically adjusts length based on trend strength, helping traders identify market momentum and potential trend reversals with enhanced precision.
A dynamic trendline drawing method that adapts to market volatility by using pivot points and Average True Range (ATR) to determine line angle and sensitivity.
A machine learning-powered trendline indicator that uses k-means clustering to automatically identify and filter price trend clusters, offering dynamic trend visualization and analysis.
Likes, views, and comments are historical TradingView snapshots. They describe attention, not trading performance.